Overview
DataFrames allow you to present data in a grid format. They provide an interface with built-in features like sorting, searching, and downloading. They work well for displaying lists of records, reports, or any tabular data that you’ve processed with Python.When to use DataFrames
DataFrames are useful for:- Data analysis results from pandas operations
- CSV file uploads that need to be displayed as tables
- Database query results formatted as DataFrames
- Any data that benefits from sorting and filtering
- Reports that users might want to download as CSV
Example: Display a sales report
This example creates a sales report from hardcoded data. It processes data with pandas and displays it in a DataFrame.Open the Code tab and edit the main.py file
Open the Code tab at the bottom of the agent’s interface and navigate to the
main.py file.Add the following code to the main.py file. It creates a pandas DataFrame with the sales data and sets it in the state as sales_report.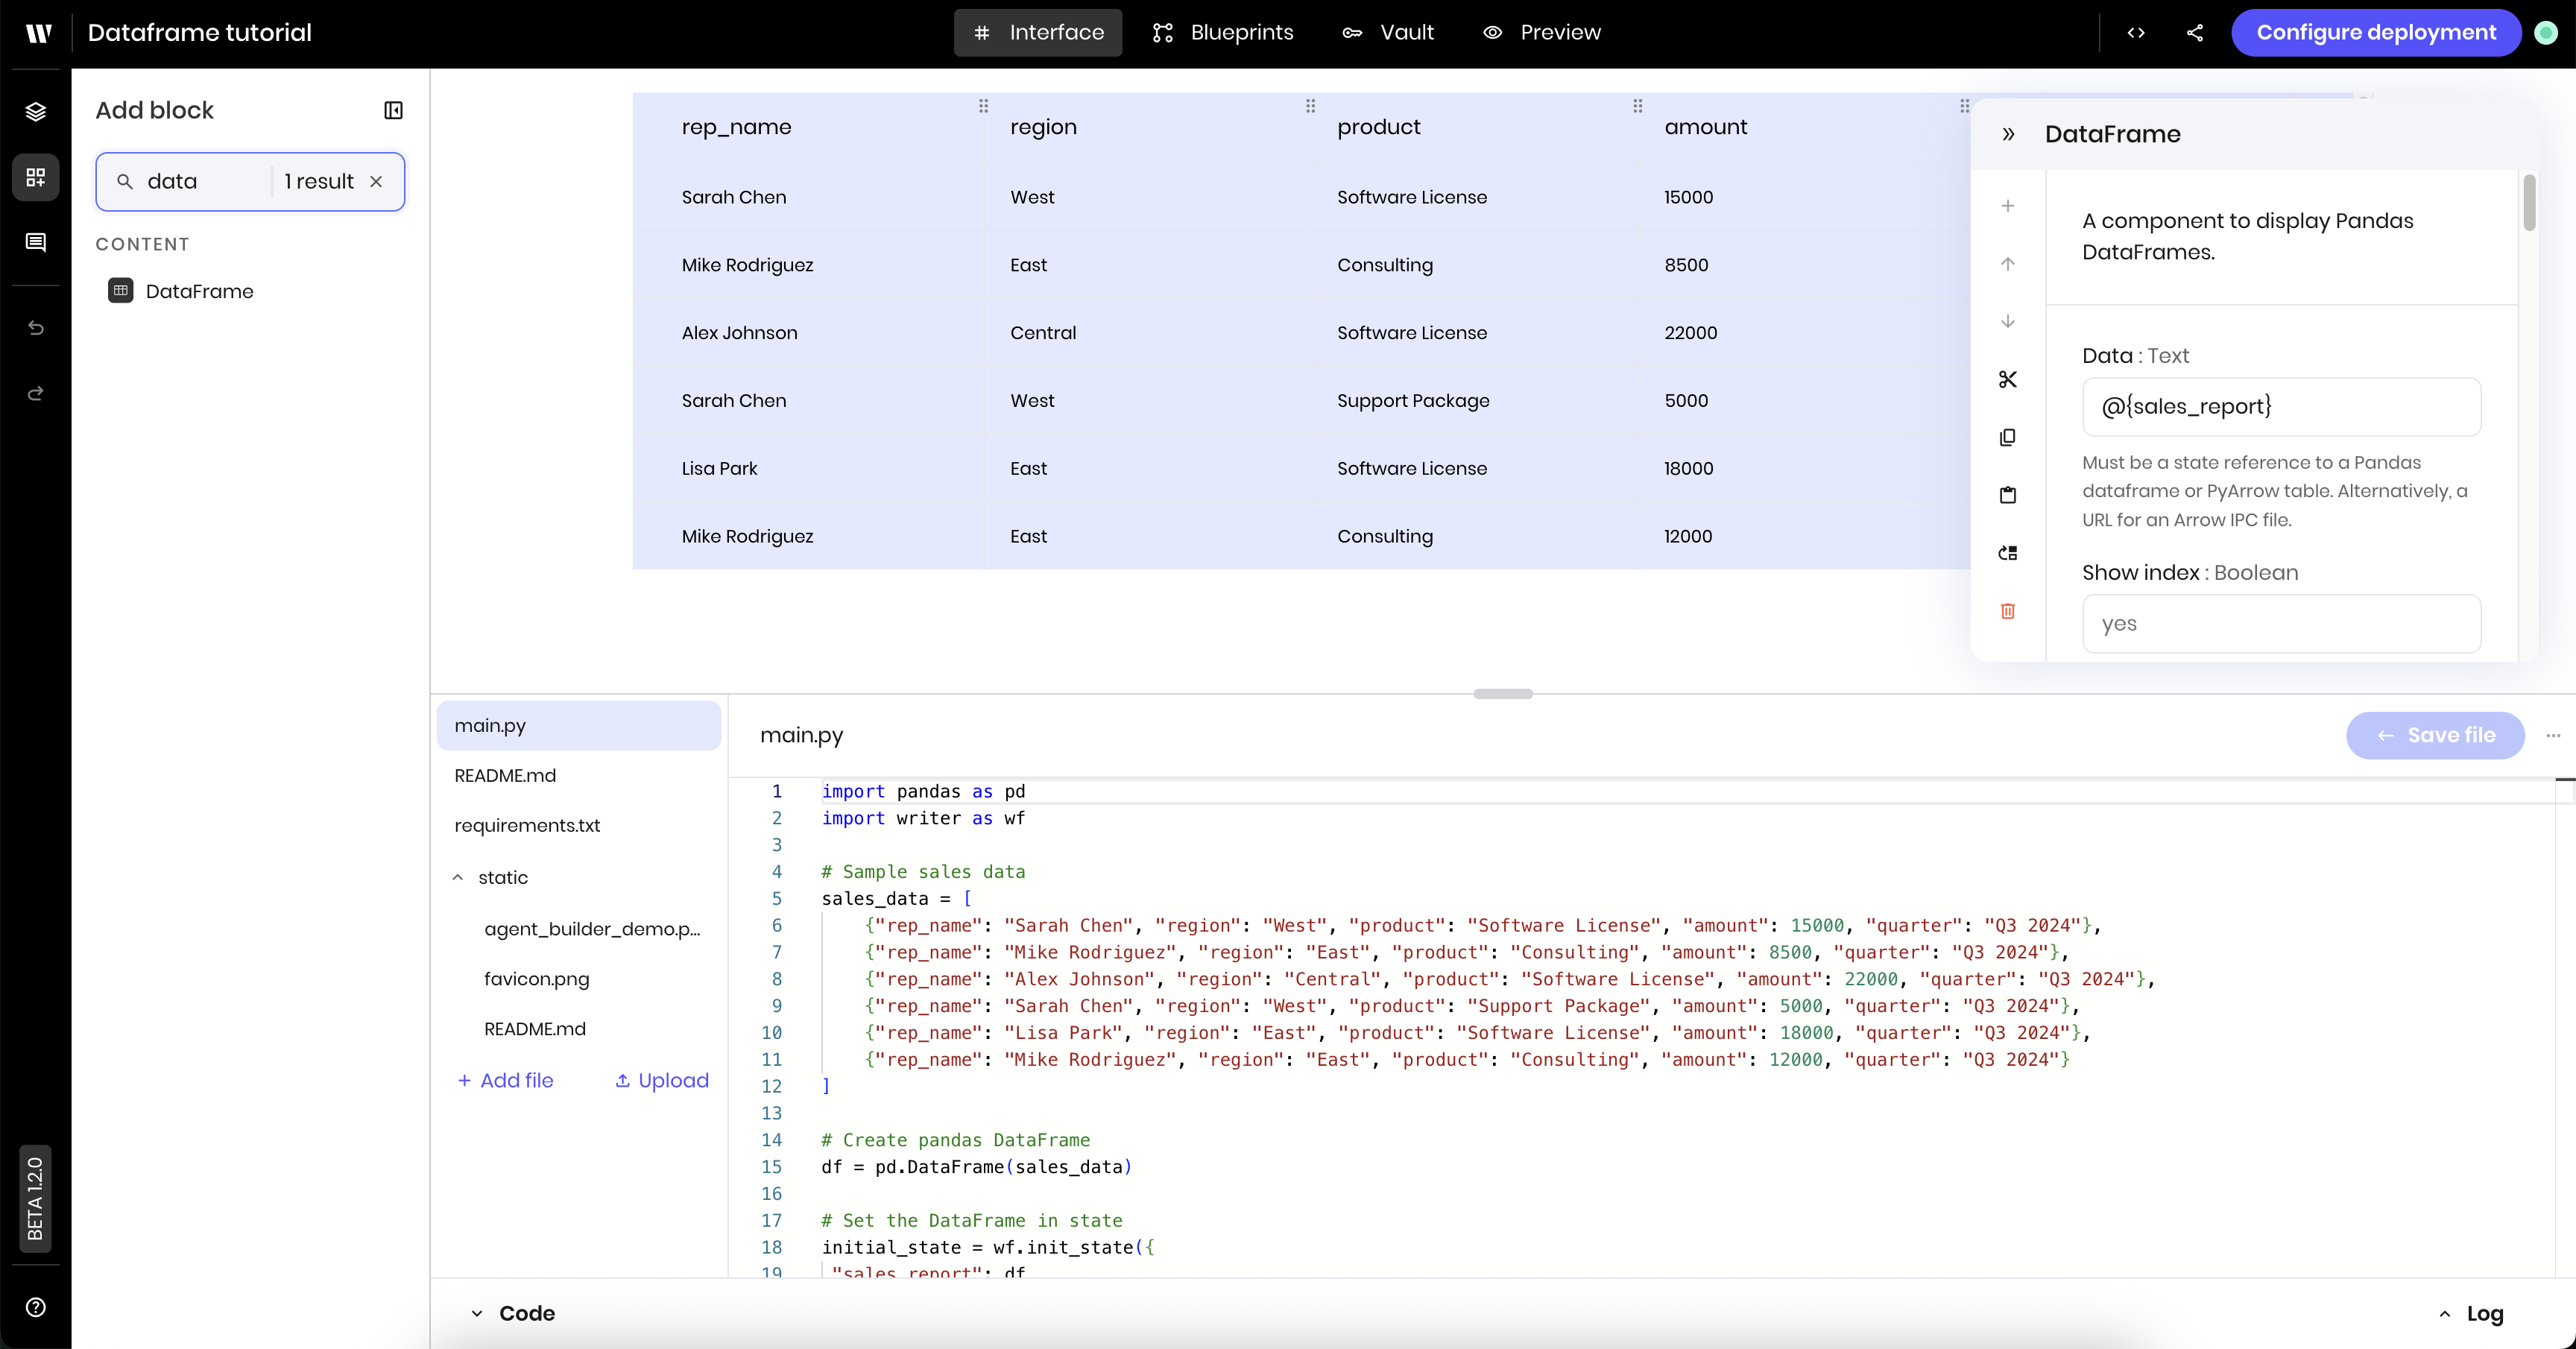
Preview the DataFrame
Navigate to the Preview tab to see the DataFrame in action. You should see a table with columns for sales rep, region, product, amount, and quarter. Try clicking column headers to sort by amount or region.Enable advanced features
Navigate back to the Interface tab to click on the DataFrame component. There, you can enable more features, like search, download, and editing or adding records.- Enable Search: In the DataFrame component settings, set Enable search to
yes - Enable Download: Set Enable download to
yes - Optionally enable editing: Set Enable adding a record and Enable updating a record to
yesif you want users to modify data - Test the enhanced features:
- Search for specific sales reps or regions
- Sort by amount to see top performers
- Download the data as CSV for further analysis
Example: CSV file upload and processing
This example shows how to upload a CSV file and process the data with pandas to then display it in a DataFrame. The example assumes you have a CSV file with the following columns:product_categoryproduct_namequantityunit_pricesales_repdateregion
Build the interface
Navigate to the Interface tab to build the agent’s interface.Add a File input component to allow users to upload the CSV file
Add a File input component to your page. Update the following settings:
- Label:
Upload CSV - Allowed file types:
.csv - Link variable under Binding:
input_file
Add a Button component to trigger the file upload
Add a Button component to your page. Update the following settings:
- Label:
Process CSV
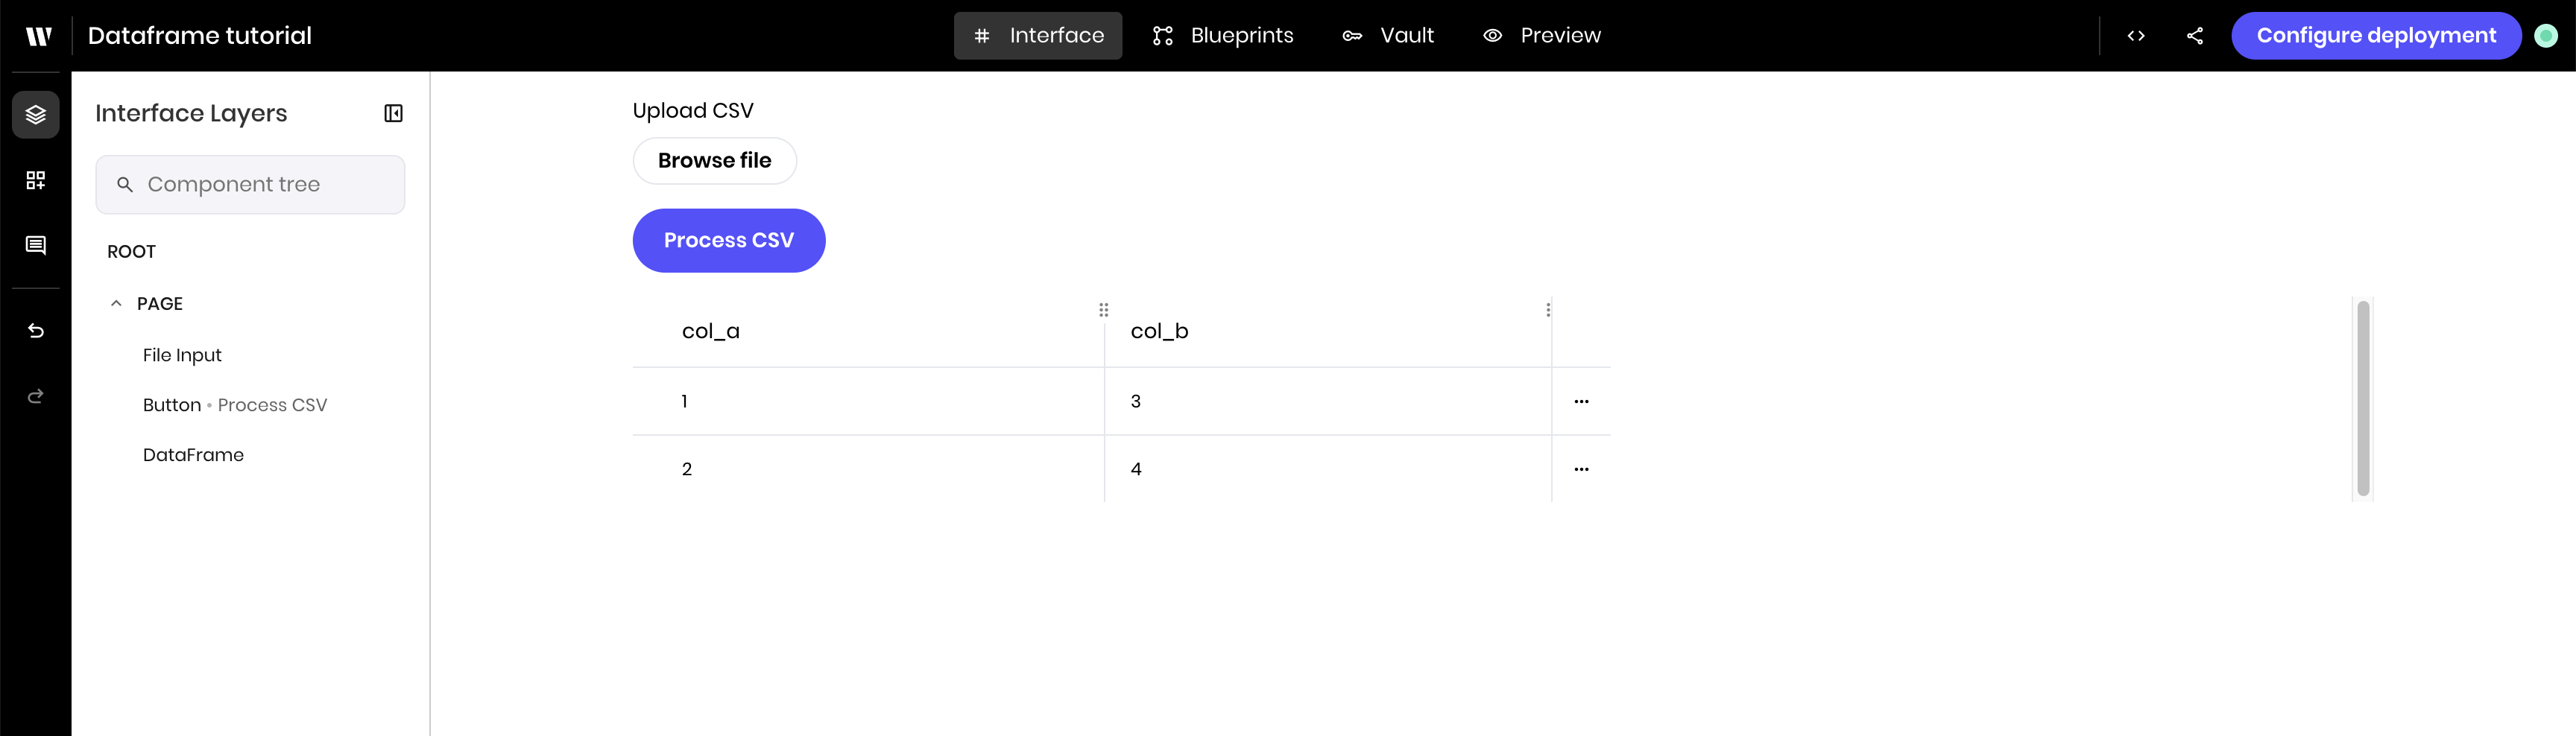
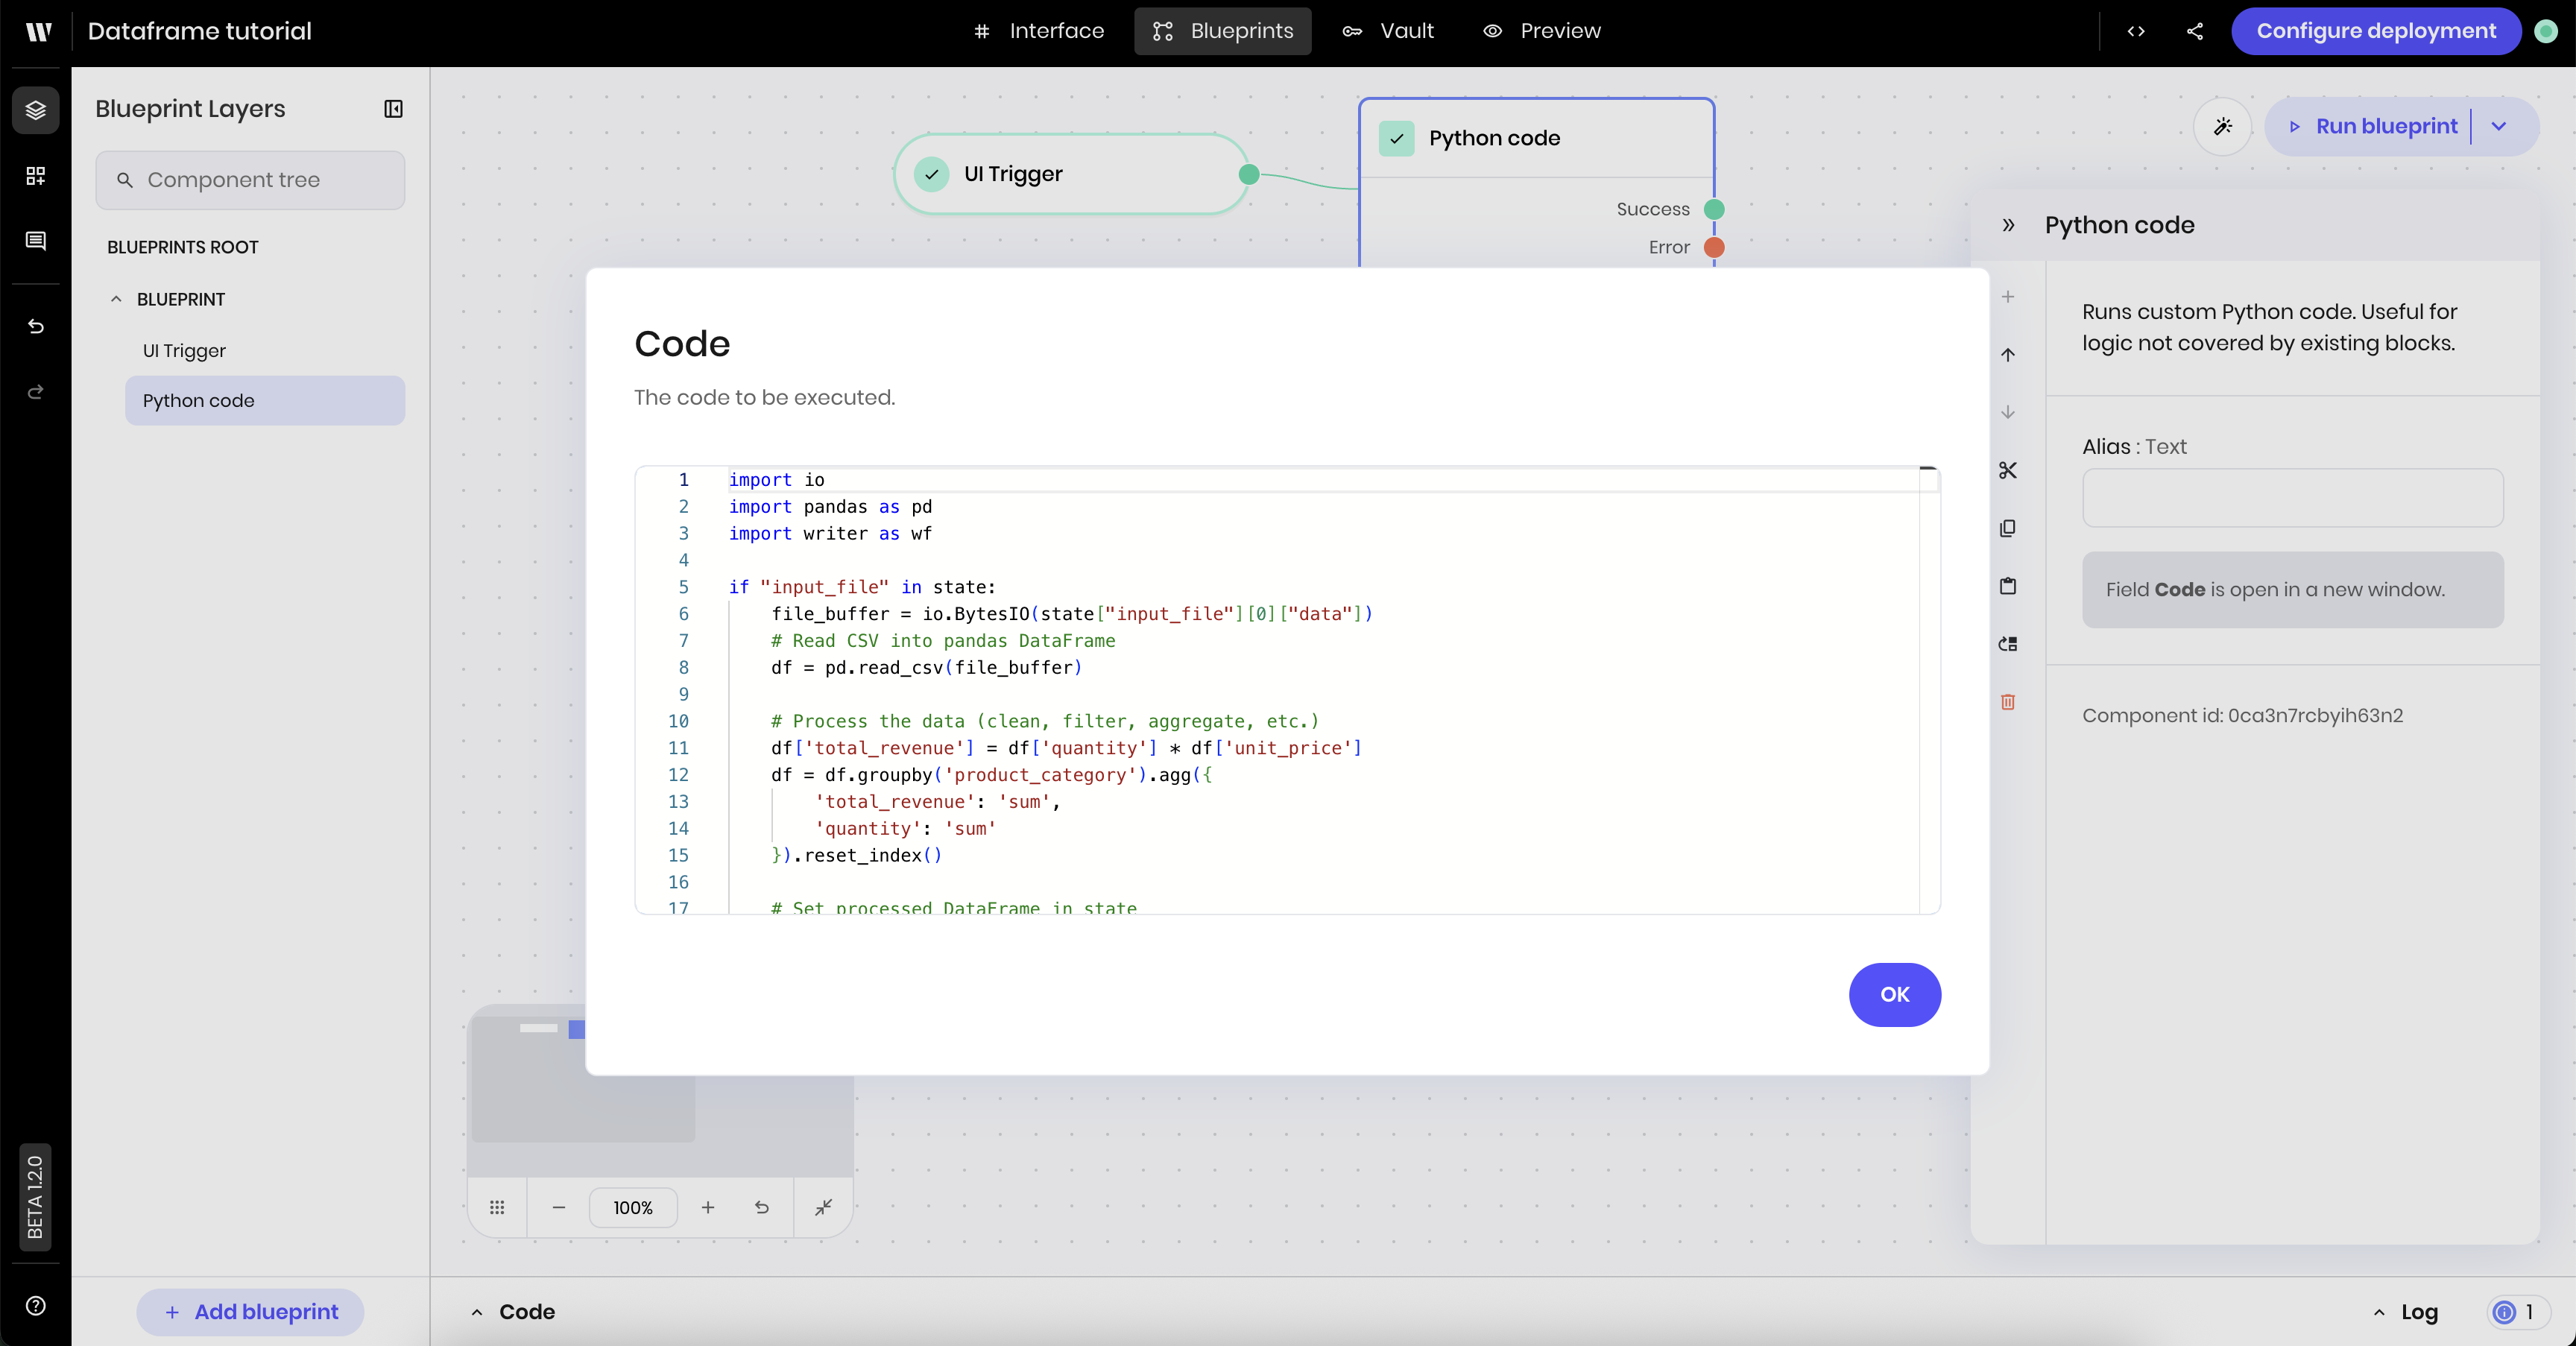
Build the blueprint
Open the Blueprint tab to build the agent’s blueprint. The blueprint contains:- A UI Trigger that triggers blueprint execution when the user clicks the Upload CSV button.
- A Python block that processes the uploaded file and stores the data in a state variable.
Add a UI Trigger
Add a UI Trigger to the blueprint. Update the following settings:
- Component Id: Select the Process CSV button you added to the interface.
- Event type:
wf-click
Preview the agent
Navigate to the Preview tab to see the agent in action. You should see a button to upload a CSV file and a table to display the processed data. Upload a CSV file; see the beginning of this example for a sample CSV file. Once you click the Process CSV button, the agent processes the data and displays it in the DataFrame component.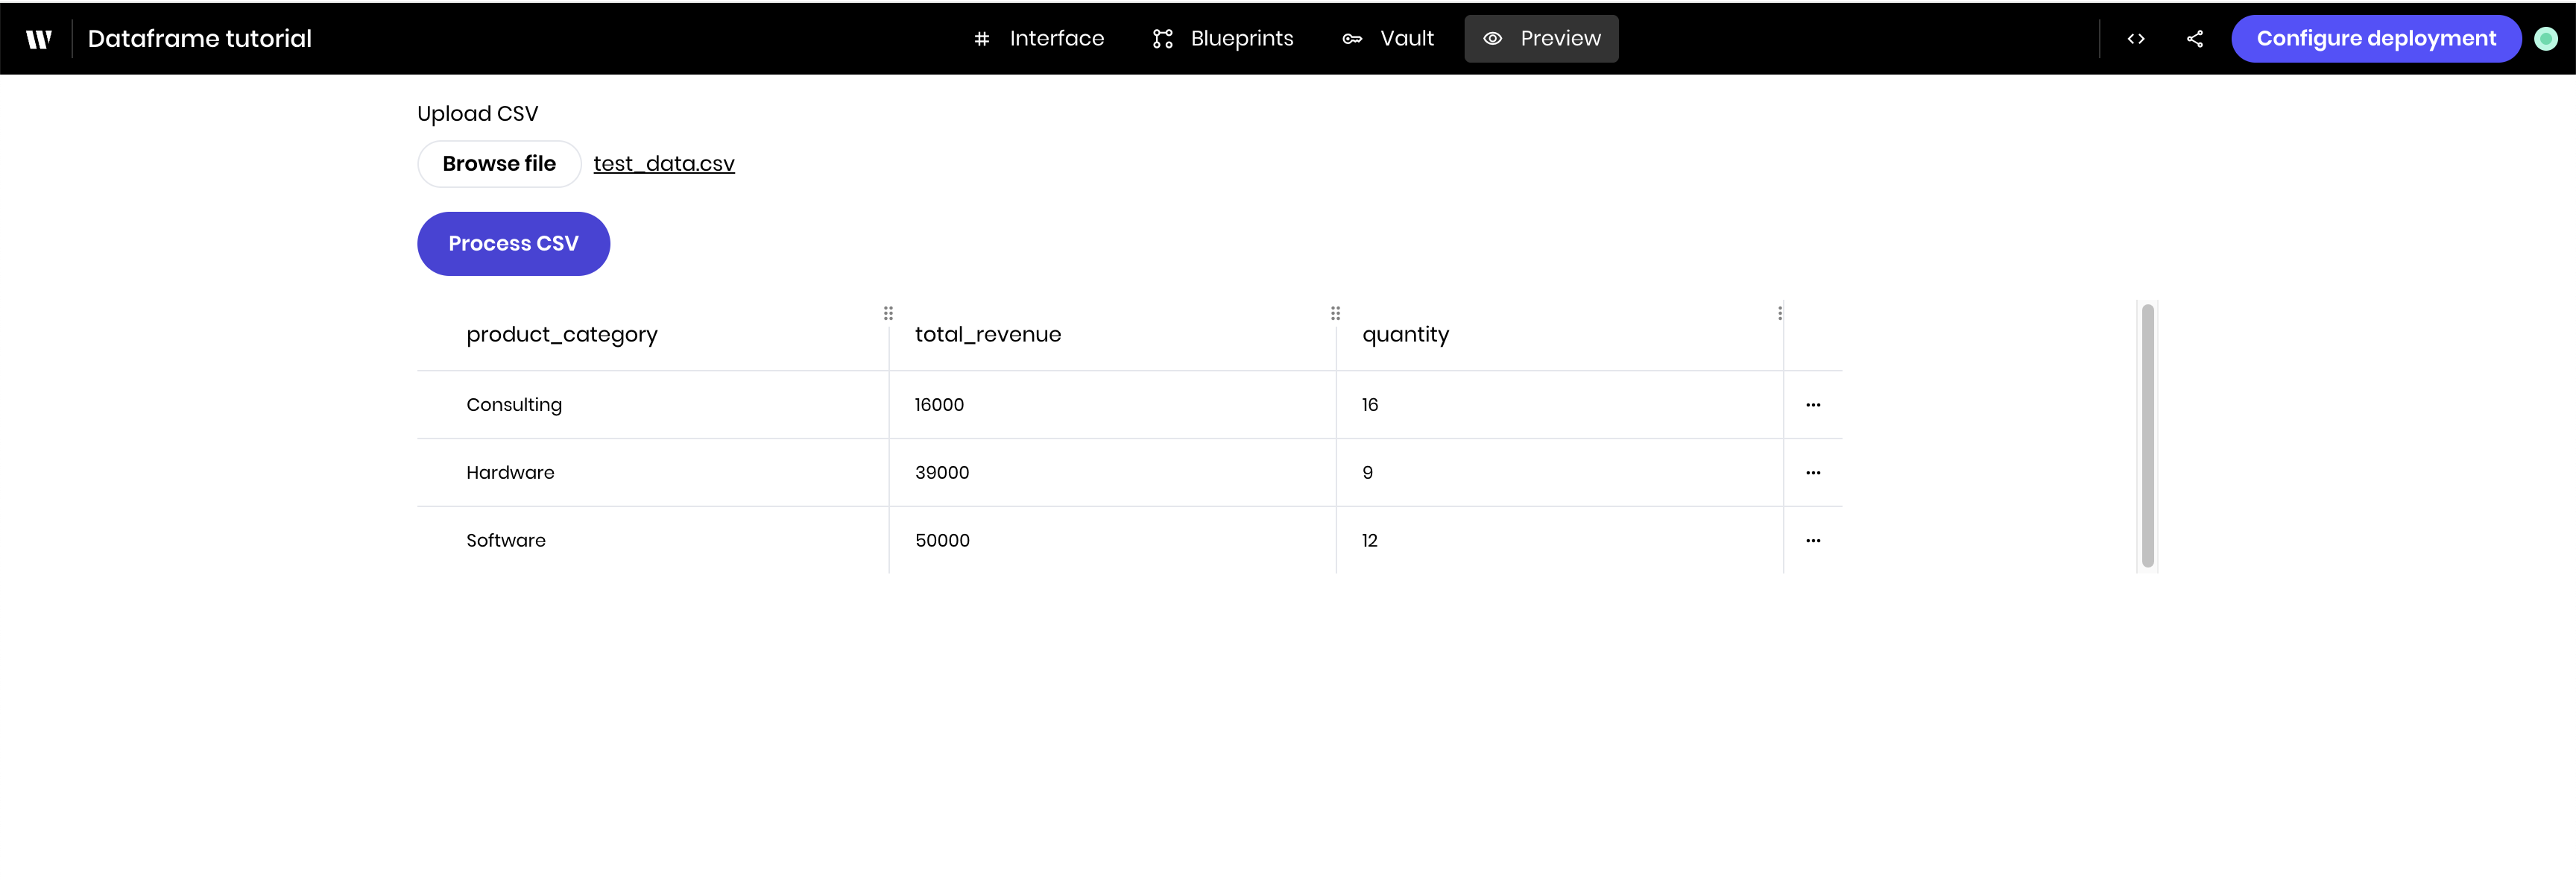
Best practices
- Use pandas for data processing: Clean, aggregate, and transform data before display
- Keep DataFrames reasonably sized: Use “Display row count” to control how many rows show simultaneously
- Enable appropriate features: Only enable editing if users should modify data
- Consider text wrapping: Toggle “Wrap text” based on your data content
- Use meaningful column names: Pandas column names become the table headers
Next steps
Try extending this example by:- Adding more sophisticated pandas operations such as
groupbyandpivot_tables - Connecting to real databases or APIs
- Creating calculated columns based on business rules
- Styling the component with custom CSS classes