The Events page is only available to organization admins, IT admins, and AI
Studio full access roles.
Event logs are available for no-code and prebuilt
agents, Agent Builder
agents, and
API/SDK usage. Event logs are not yet
available for WRITER Agent.
Access the Events page
To open the Events page, log in to AI Studio, select Billing & reporting in the left sidebar, then select Observability.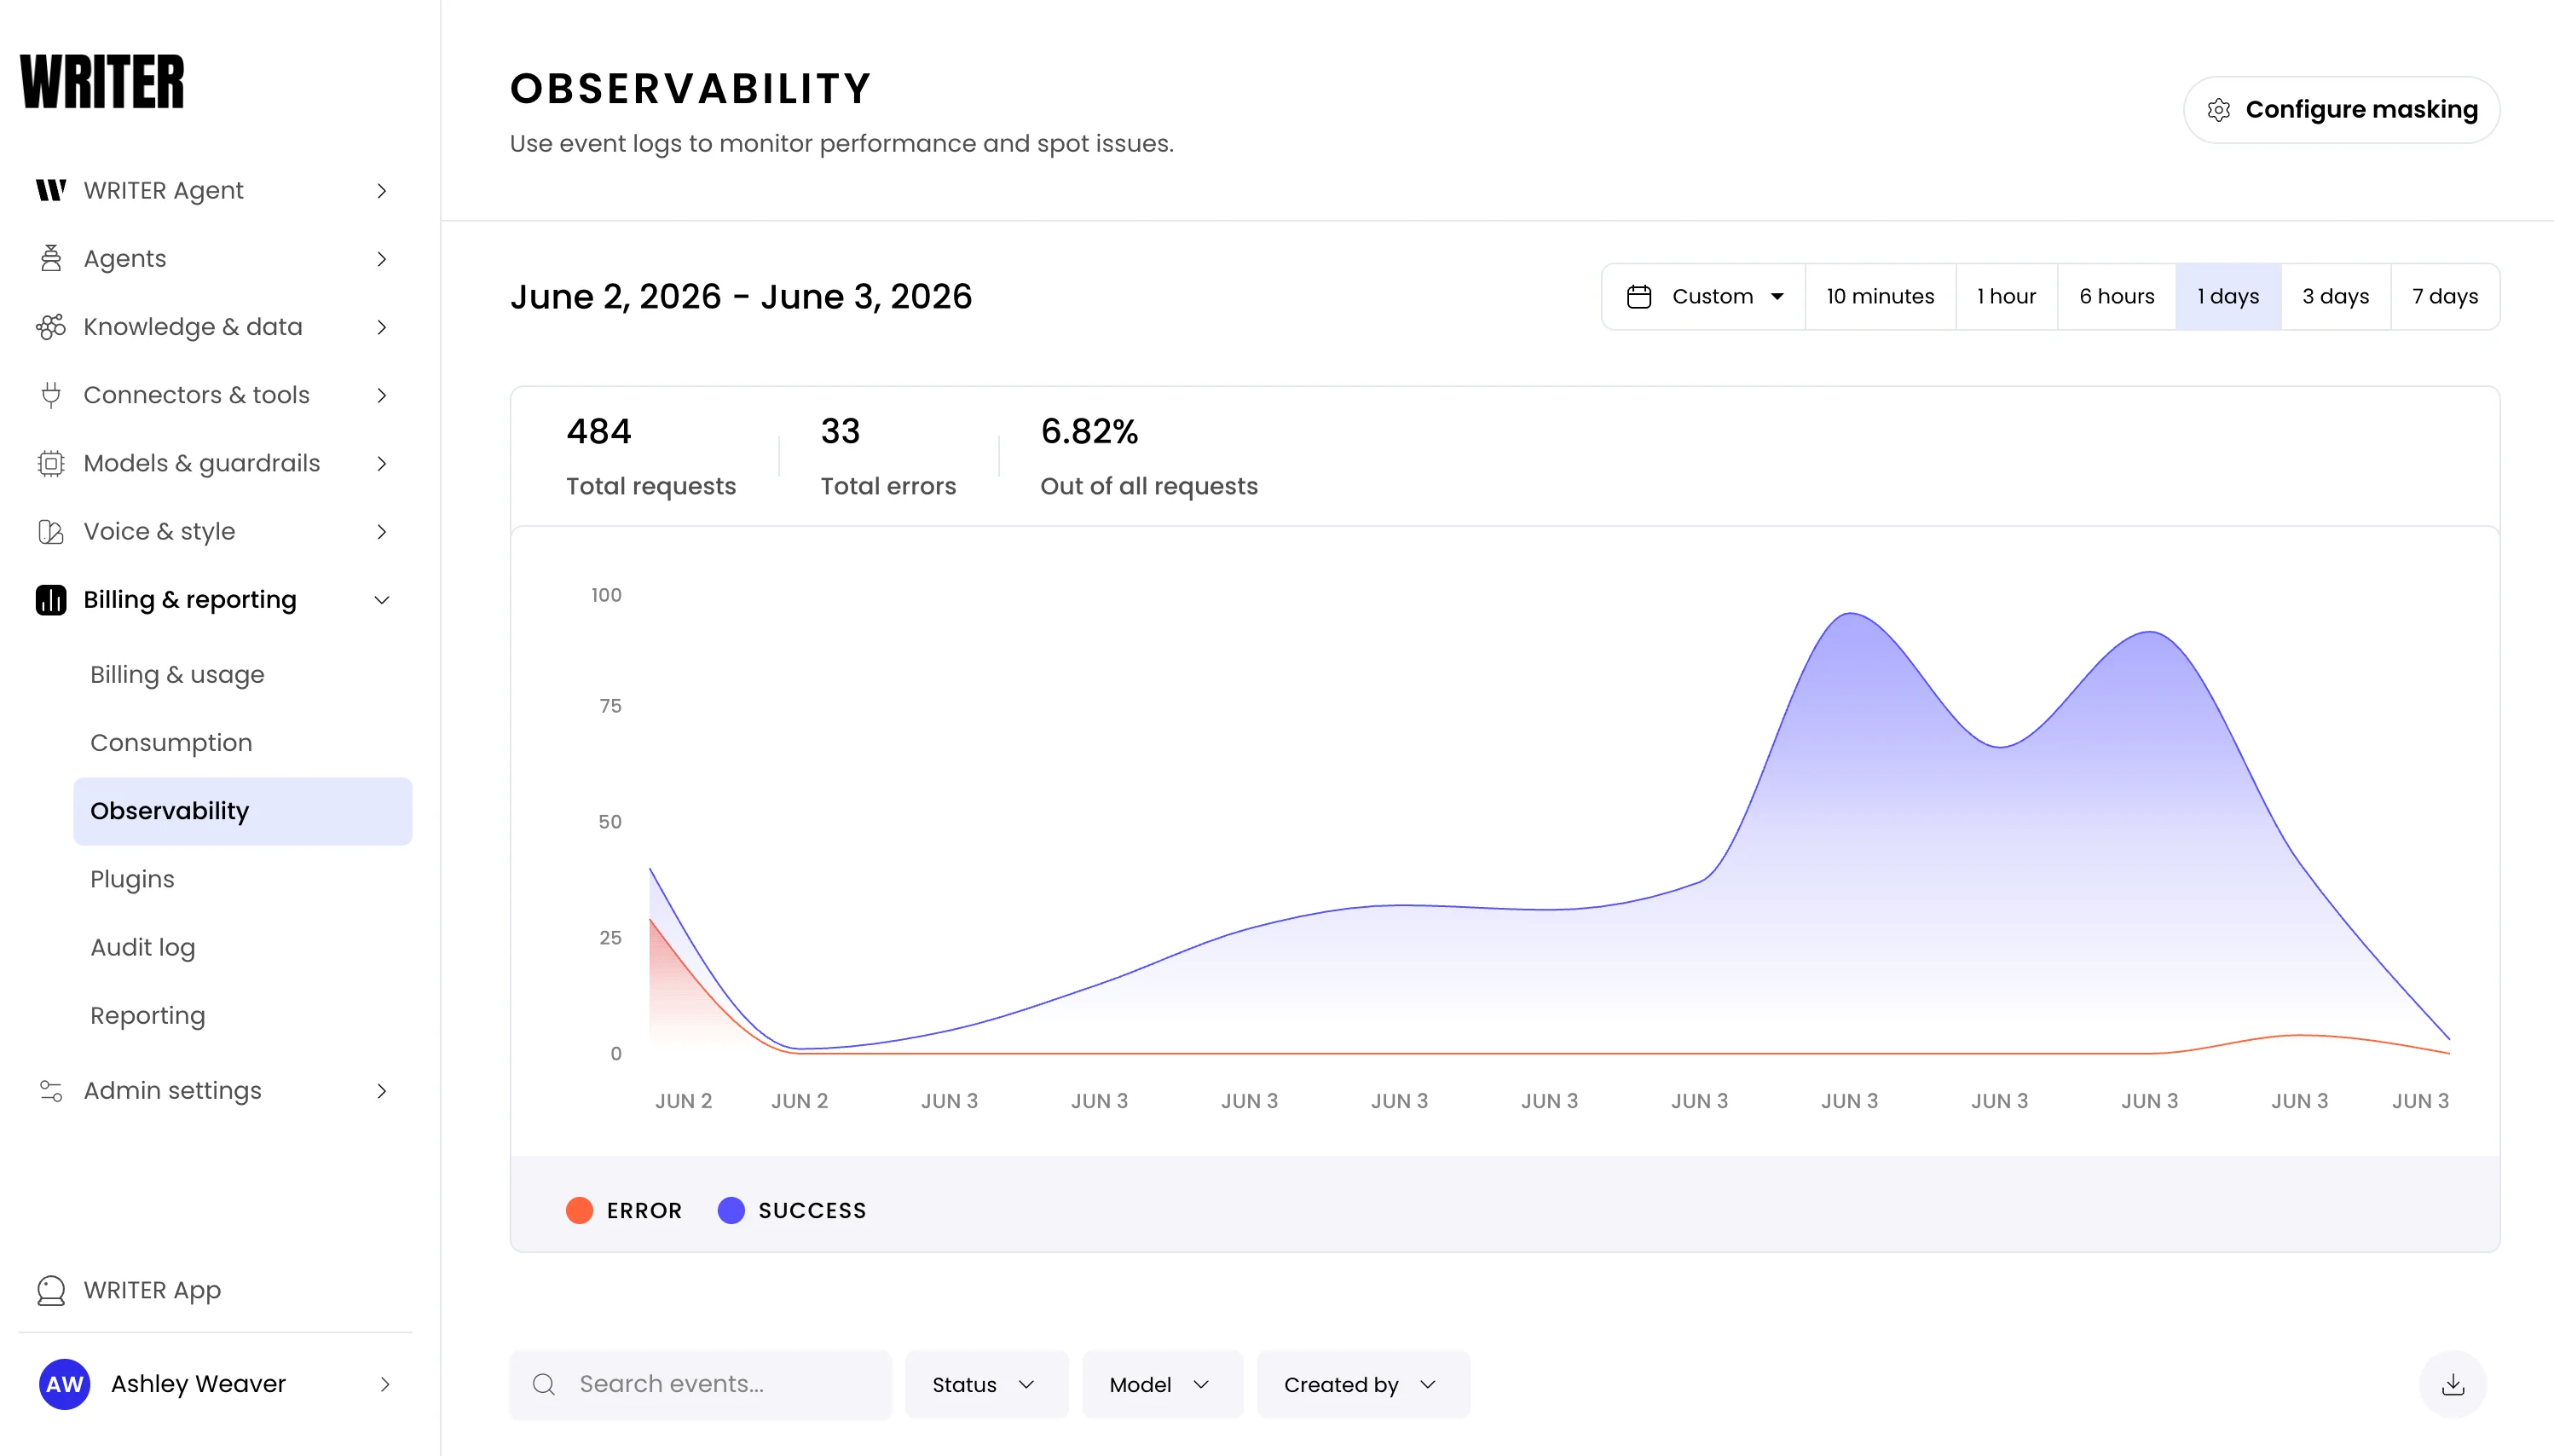
Find specific events
The events table lists every request with its timestamp, HTTP status code, model, session ID, who created it, and latency. To narrow the table to the events you need, use any combination of the following:- Filters—narrow by status (success or failure), model, or the user that created the request. Combine filters to isolate specific scenarios, such as all failed requests for a particular model.
- Search—search by exact request ID or session ID to locate a specific event.
- Time range—adjust the time window to focus on a specific period of activity.
The Created by field displays a name only when the completion request is
sent by an Agent Builder or no-code application. Requests sent through the
public API display N/A for this field.
Export event logs to CSV
Download event data as a CSV file for offline analysis, audits, or sharing with your team. The export reflects the events in the events table for your current view. To export events, select the download button to the right of the search and filter controls above the events table.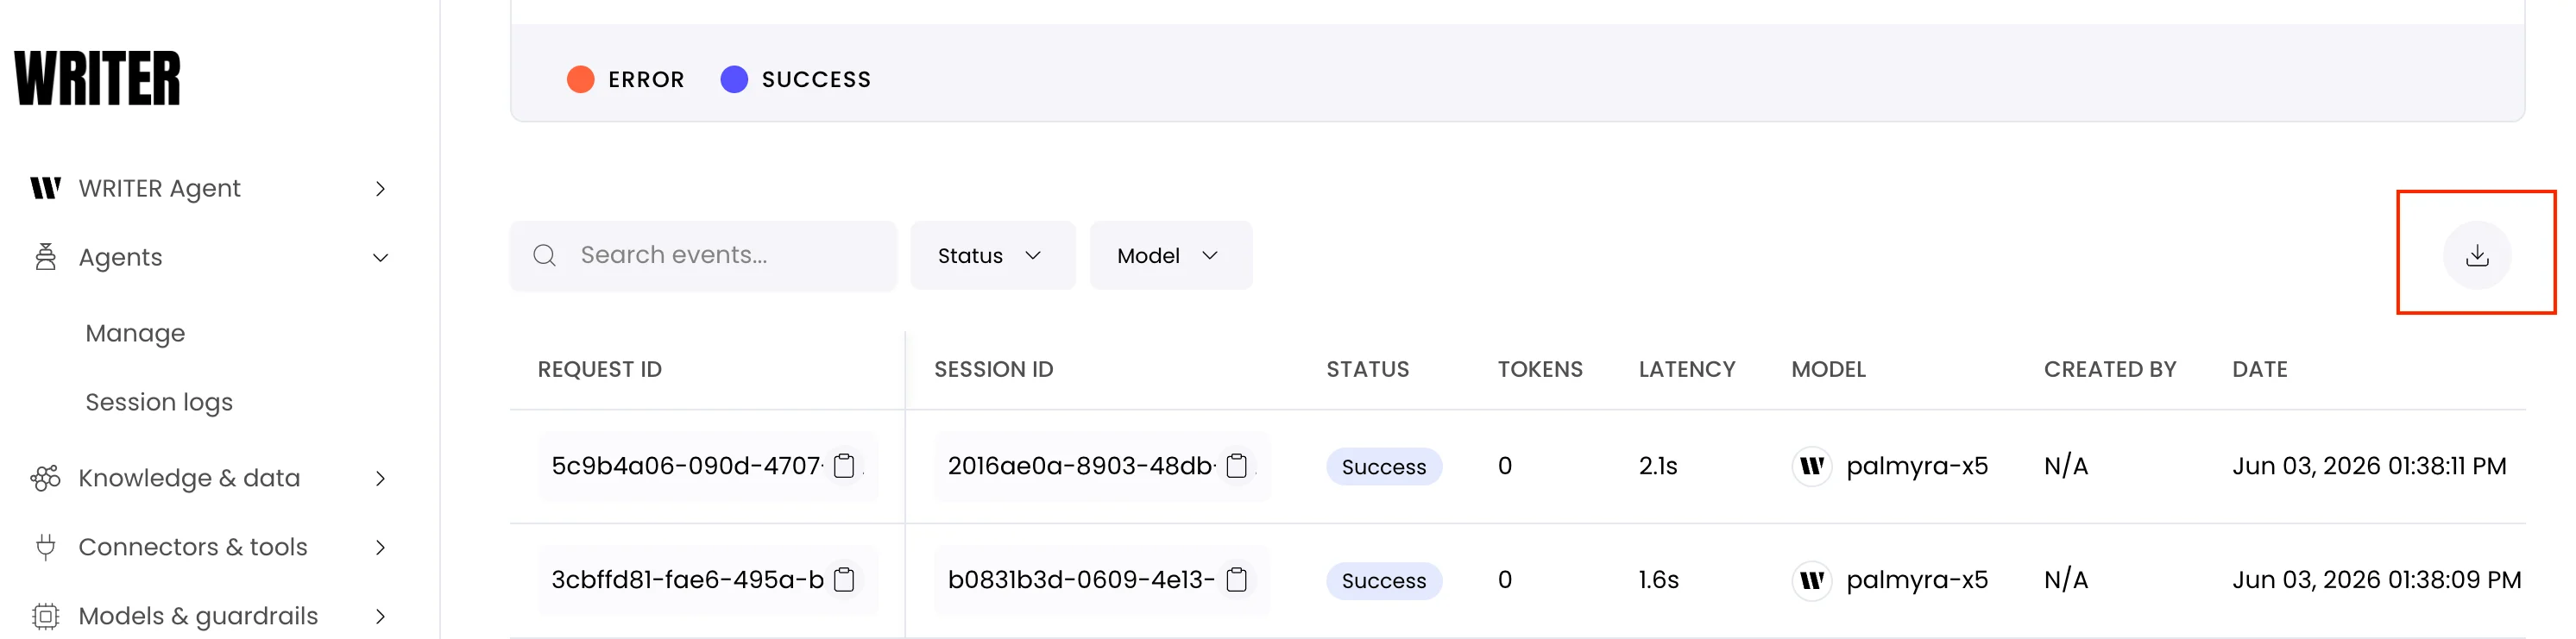
- Time range—the export includes only events within the time range currently selected on the Events page.
- Masking—if content masking is enabled, request and response columns are hidden in the export, matching what you see in the event detail panel.
Inspect an event
Select any row in the events table to open the detail panel. The panel has three tabs:- Details—session and request IDs, timestamp, latency, status, request type, cache hit status, token usage and cost, model and provider, and runtime (start time, end time, duration).
- Request—the full JSON request payload.
- Response—the full JSON response payload.
If prompts and responses appear as empty values,
masking is enabled.
Mask sensitive content
Event logs can capture sensitive information from user prompts and LLM responses. To protect this data, content masking hides these fields in the event detail panel, where they appear as empty values. Masking is enabled by default. To configure masking, select the Configure masking control on the Events page. Choose one of the following options and select Confirm:- Enable masking—user prompts and LLM responses are hidden. These fields appear as empty values in event logs.
- Disable masking—user prompts and LLM responses are fully visible in event logs.
Masking also applies to CSV exports and data
forwarded through observability plugins, such as
Datadog Logs.
Next steps
- Agent observability: Drill into session logs and performance metrics for individual agents
- Usage and spend: Track organization-wide costs and token consumption
- Configure plugins: Stream event data to external platforms like Datadog