

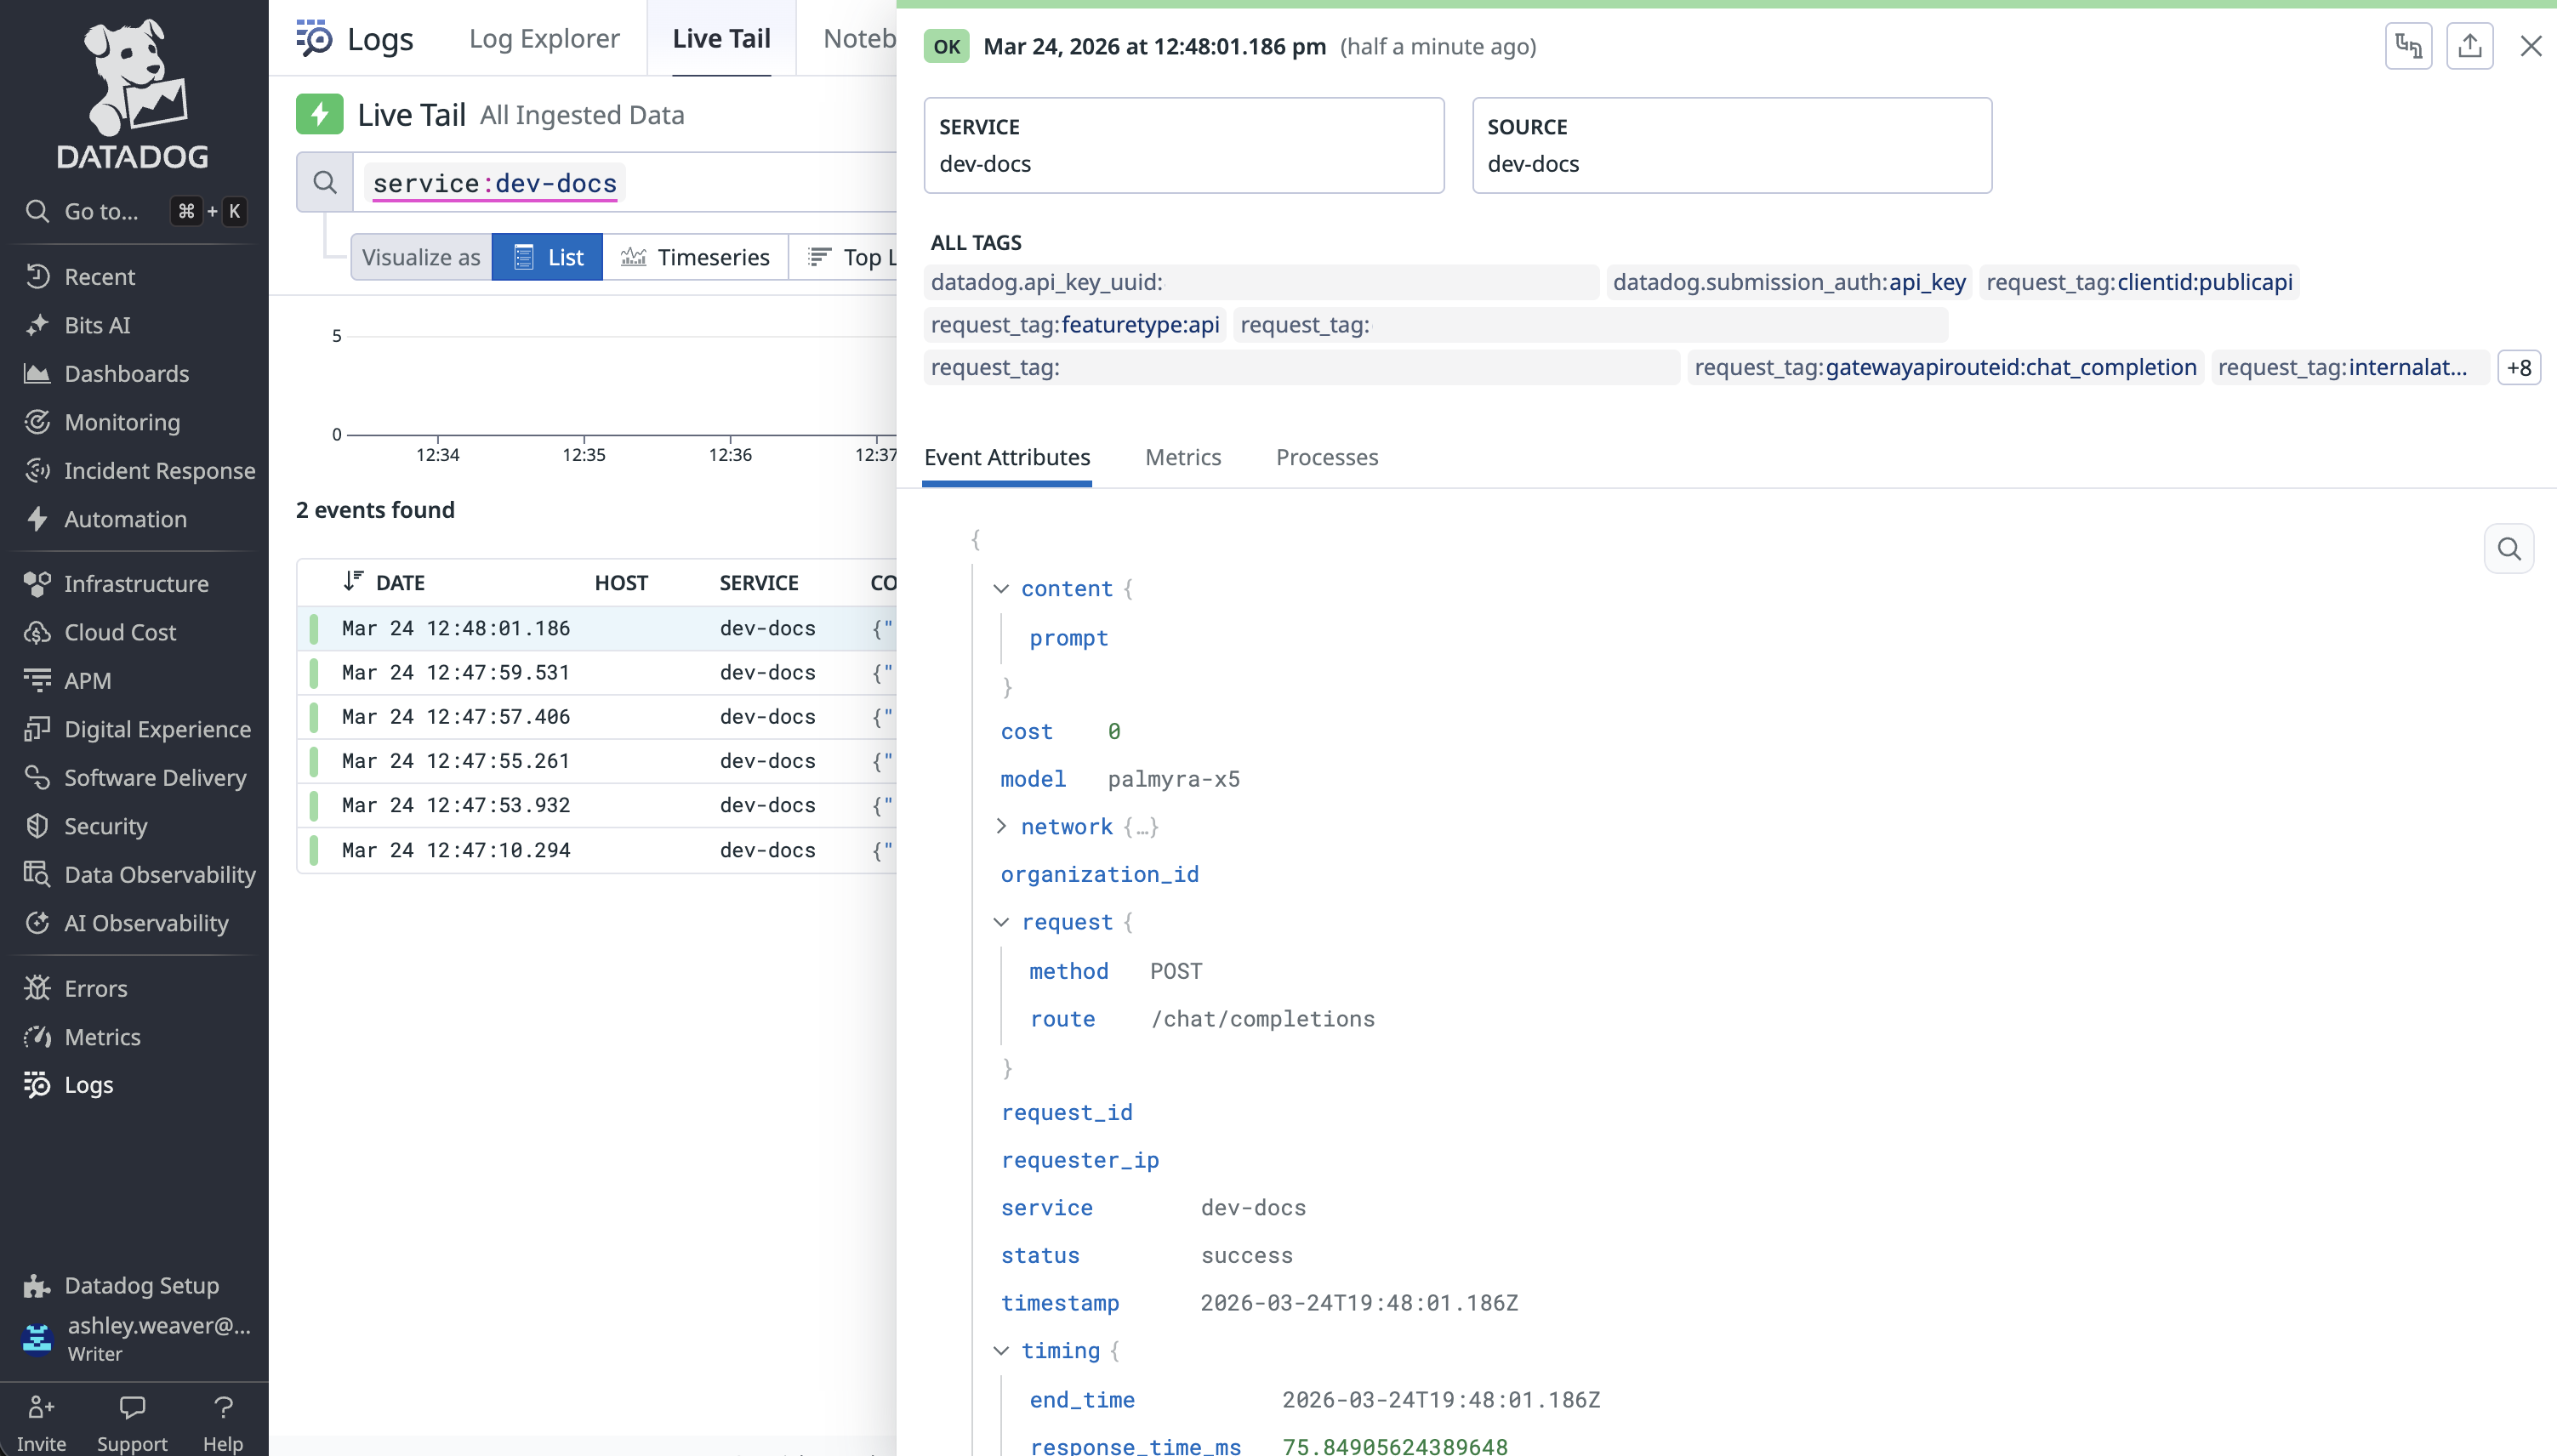
- Model and routing metadata: The model used and the API route that handled the request
- Token usage: Prompt tokens, completion tokens, and total tokens consumed per request
- Performance data: Success/failure status, latency, and error details when applicable
- Cost: Per-request spend attributed to the organization and model
- Prompt and response content: The full prompt and completion text, when available
If content masking is enabled in
event logs, prompts and responses forwarded to Datadog are also masked.
Set up the Datadog Logs plugin
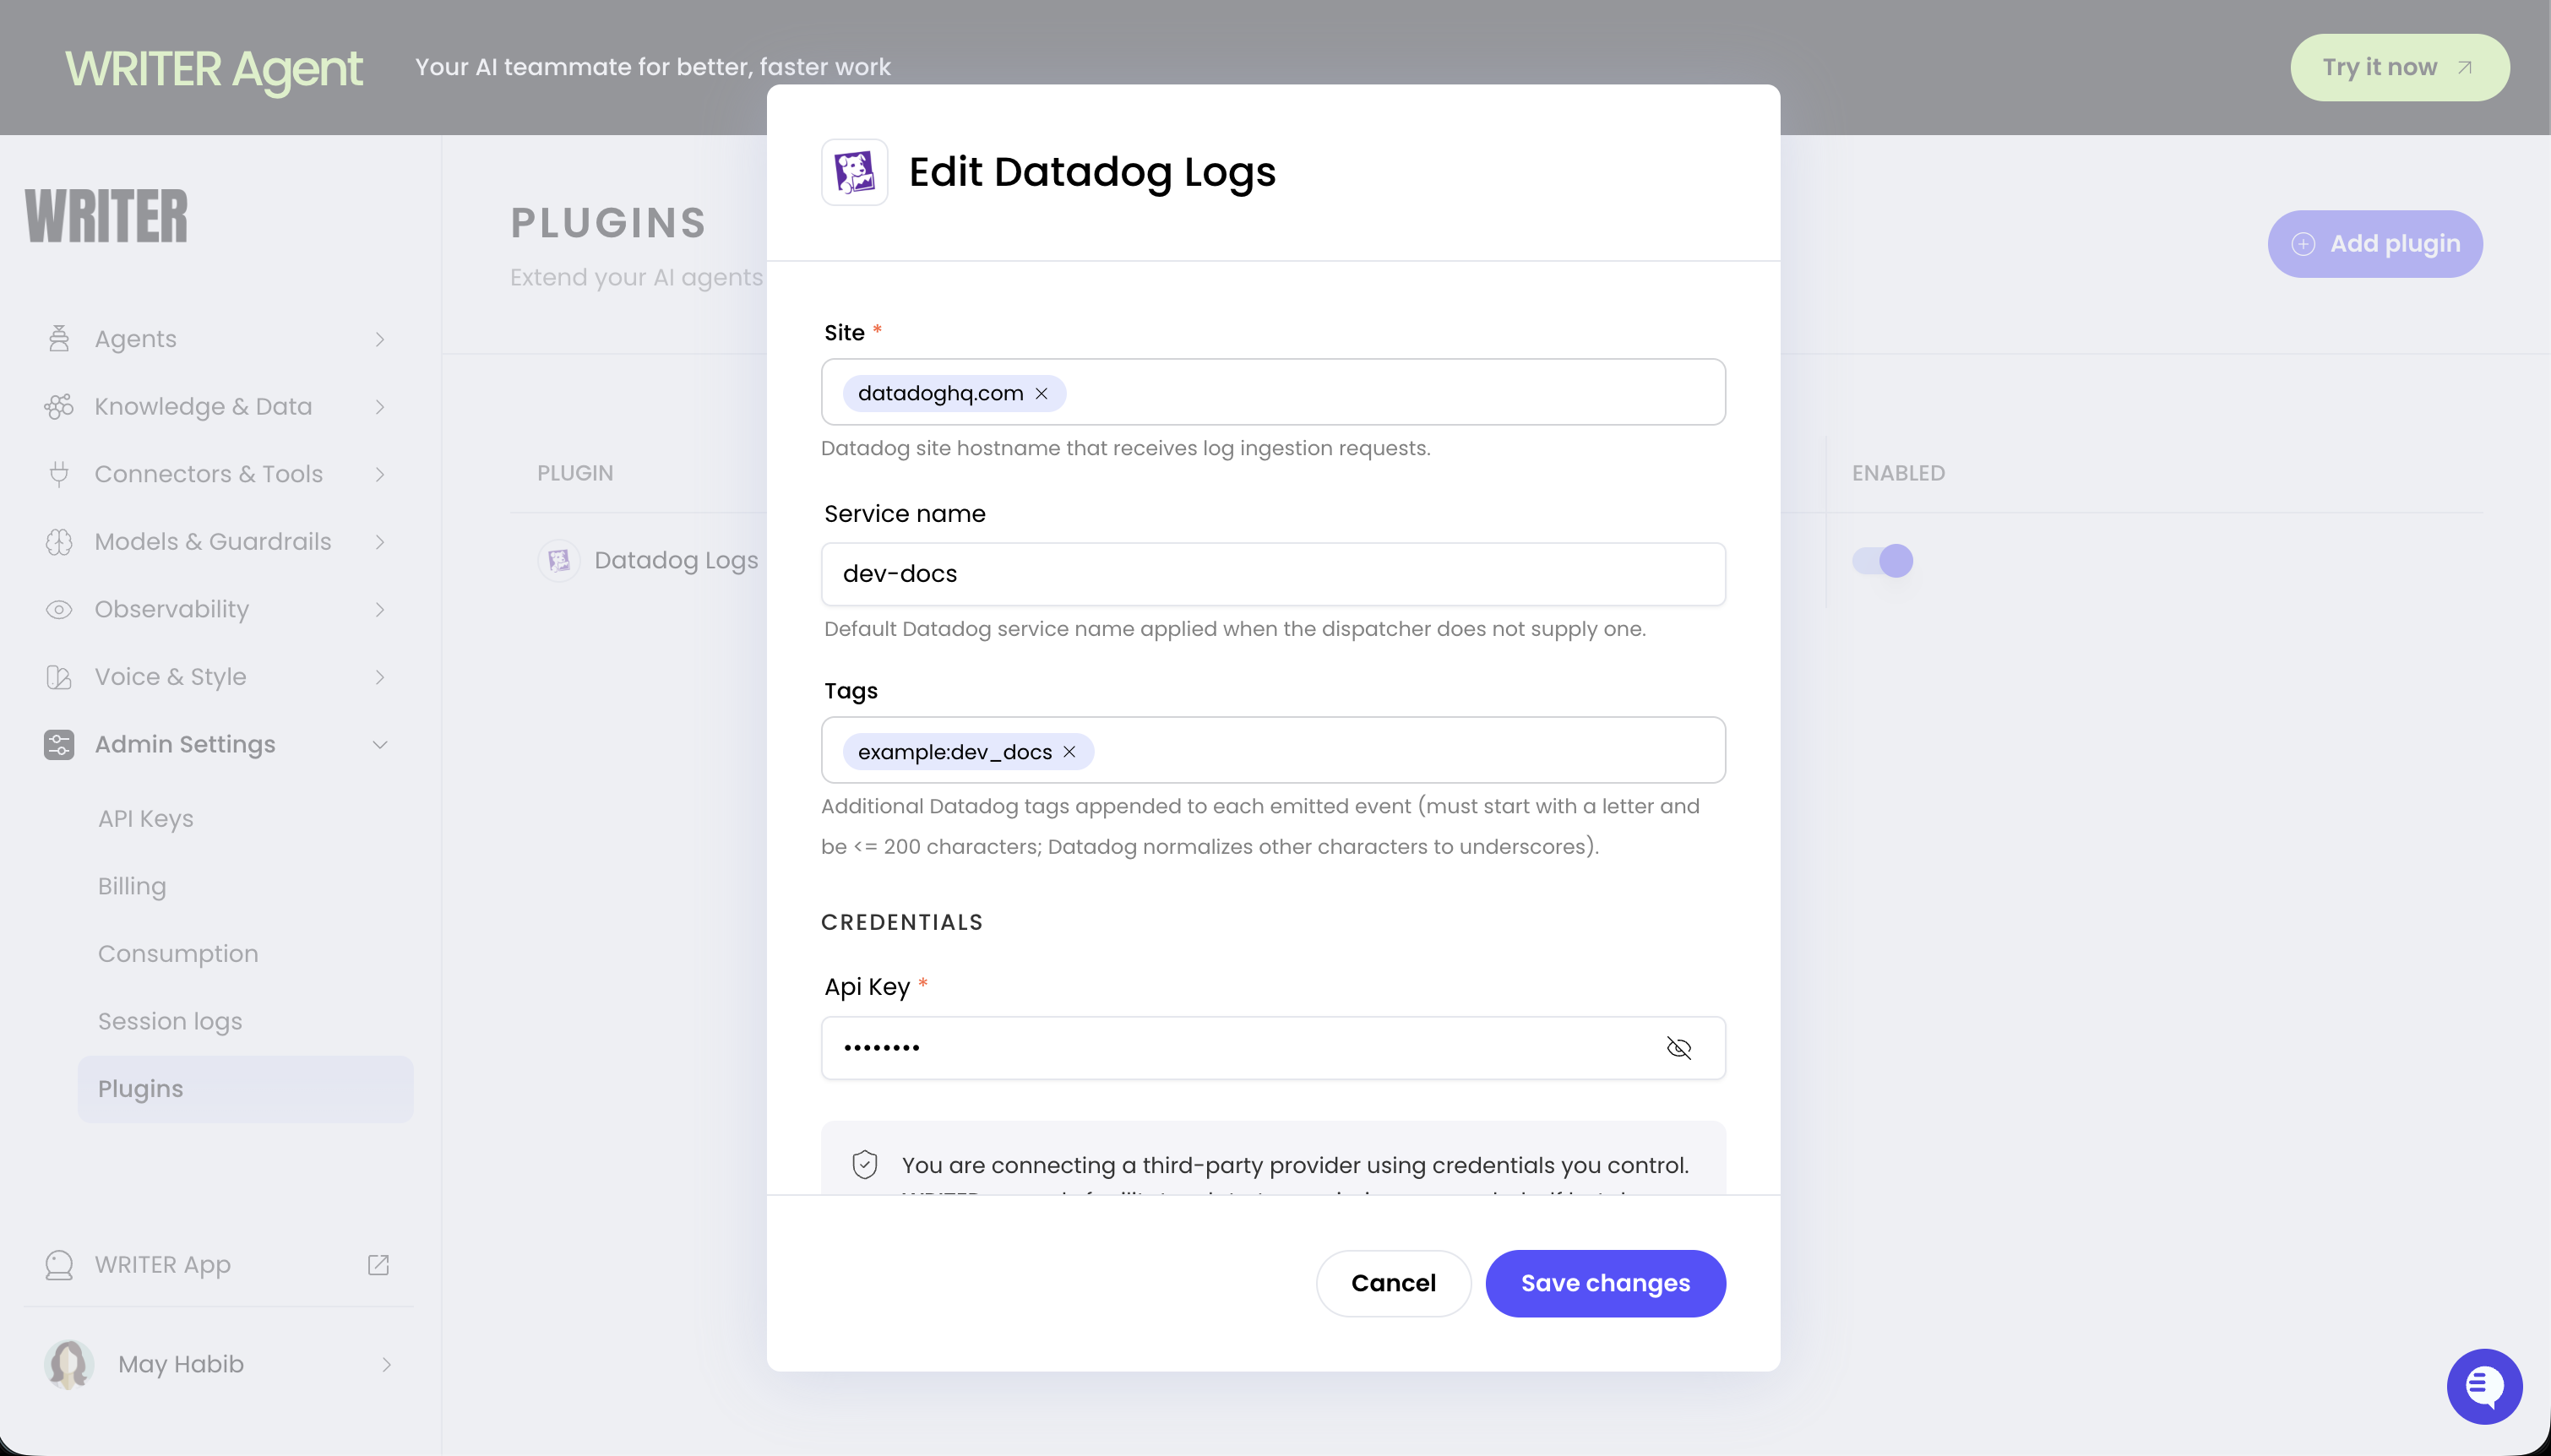
Configure the Datadog Logs plugin in AI Studio under Plugins.Obtain your Datadog API key
Before configuring the plugin in AI Studio, locate your API key in Datadog:- Log in to your Datadog account
- Navigate to Organization Settings → API Keys
- Copy an existing API key or create a new one
Identify your Datadog site region
Determine which Datadog site your organization uses. The Site hostname value controls which regional endpoint receives your logs.
For more information on Datadog regions, see Datadog regions documentation.
Optional: Configure tags
Tags can be a standalonevalue or a key:value pair that Datadog attaches to your log events for filtering, aggregating, and grouping logs in dashboards, monitors, and alerts.
The following table shows common tag examples:
For more information on tagging requirements and strategies, see the Datadog tagging documentation.
Configure the plugin in AI Studio
After obtaining your API key and identifying your site region:- Navigate to AI Studio
- Open the Datadog Logs plugin configuration
- Enter your configuration values:
- Select Save to activate the plugin
Next steps
- Observability overview: Monitor events, errors, and performance across your deployment
- Agent observability: Track individual agent performance with session logs and metrics
- Configure plugins: Manage plugins across your organization