

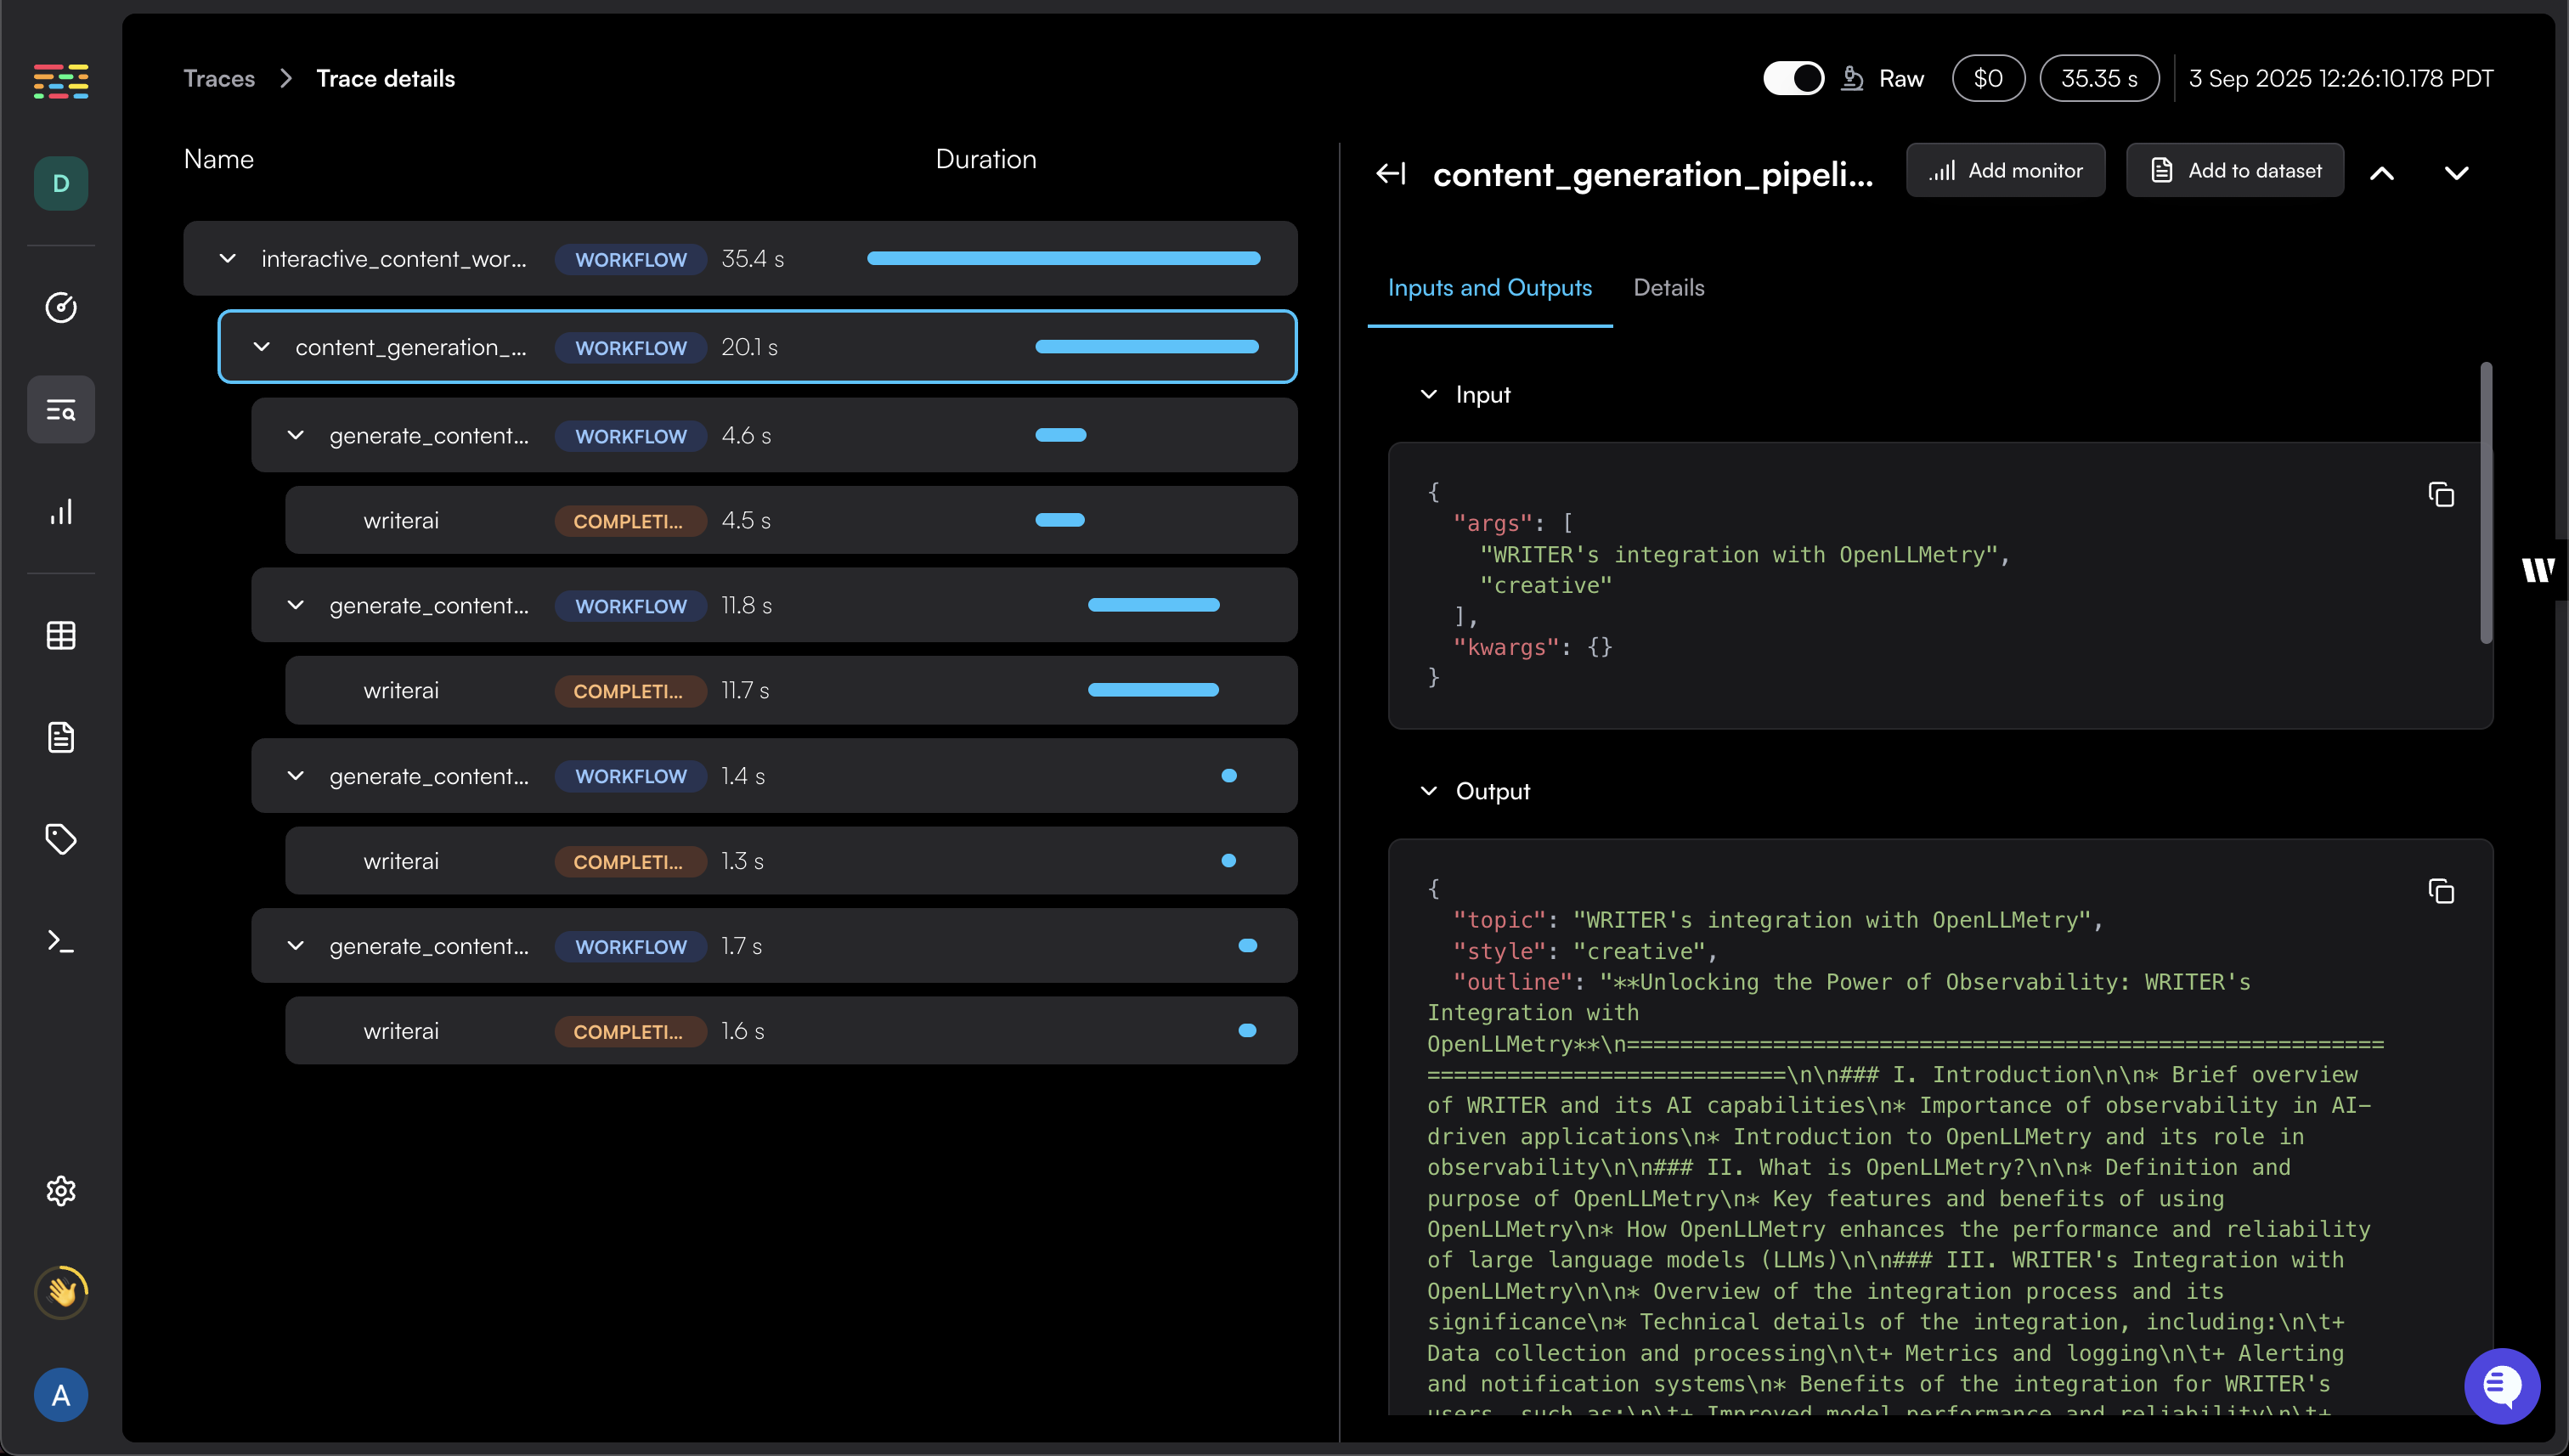
What is OpenLLMetry?
OpenLLMetry is an open source project that enables monitoring and debugging of LLM application execution. It provides non-intrusive tracing built on top of OpenTelemetry, allowing you to export traces to your existing observability stack. Since it’s built on OpenTelemetry, you can use any OpenTelemetry compatible backend (Jaeger, Zipkin, Datadog, New Relic, etc.) or the hosted Traceloop platform.What you get with the Writer integration
The Writer integration with OpenLLMetry provides enhanced observability beyond standard OpenTelemetry traces. You’ll see detailed information about your Writer API calls as additional span attributes:gen_ai.request.model: the model requested (for example,palmyra-x5)gen_ai.prompt: array of prompts sent to the Writer modelgen_ai.completion: array of completions returned from Writergen_ai.usage.total_tokens: total tokens usedgen_ai.usage.prompt_tokens: number of tokens used for promptsgen_ai.usage.completion_tokens: number of tokens used for completions
For a complete list of supported attributes, see the full GenAI Semantic Conventions.
Prerequisites
Before you begin, make sure you have:- Python 3.11 or higher installed
- A Writer AI Studio account
- A Traceloop account
- A Writer API key. See instructions in the API Quickstart
- Basic familiarity with Python and OpenLLMetry concepts
The example below uses Traceloop as the observability provider. See the connect to an external provider section to learn how to connect to other providers.
Configuration details
For additional configuration option details, see the SDK initialization docs.
Integrate Writer with OpenLLMetry
1. Install the SDK
Install OpenLLMetry in your Python environment:2. Initialize and configure
In your Writer application, initialize the Traceloop tracer. For local development, you may want to disable batch sending to see traces immediately.3. (Optional) annotate your workflows
Workflow annotations help organize and group related operations for better trace visualization and debugging. When to use decorators:- Complex processes: Group related API calls and business logic into logical workflows
- Custom naming: Override automatic span naming with business-context names
- Hierarchical tracing: Create parent-child relationships between workflows and tasks
Workflow annotations are optional. OpenLLMetry traces Writer API calls automatically without needing any decorators or additional code.
Connect to external providers
Because the Traceloop SDK is built on OpenTelemetry, the data it generates can be used in any observability platform that supports the OpenTelemetry standard. OpenLLMetry extends this by using the OTLP protocol to connect with external observability providers, letting you send traces directly to your existing stack without relying on Traceloop’s hosted platform.Configure external provider connection
To connect to an external provider, configure the following environment variables:Example configurations
Grafana Cloud
Datadog
New Relic
For a complete list of supported integrations, see the full OpenLLMetry integrations catalog.
Next steps
Now that you’ve set up Writer with OpenLLMetry, you can start monitoring your LLM applications. See the following resources to help you get the most out of your integration:- Explore OpenLLMetry’s advanced features for more detailed tracing capabilities
- Learn about workflow annotations to better organize your traces
- Set up custom integrations with your existing observability stack
- Review the Writer OpenLLMetry integration for additional details and examples