

Agent Builder v2 is in open beta. Features and limitations described here are subject to change.
This page covers monitoring for an individual Agent Builder v2 agent. For organization-wide observability—captured LLM calls across your account, usage and spend, and export APIs—see Observability overview.
Review request performance
The Performance view shows request-level metrics for the agent’s container over a selected time range, including request volume, latency, and error rate.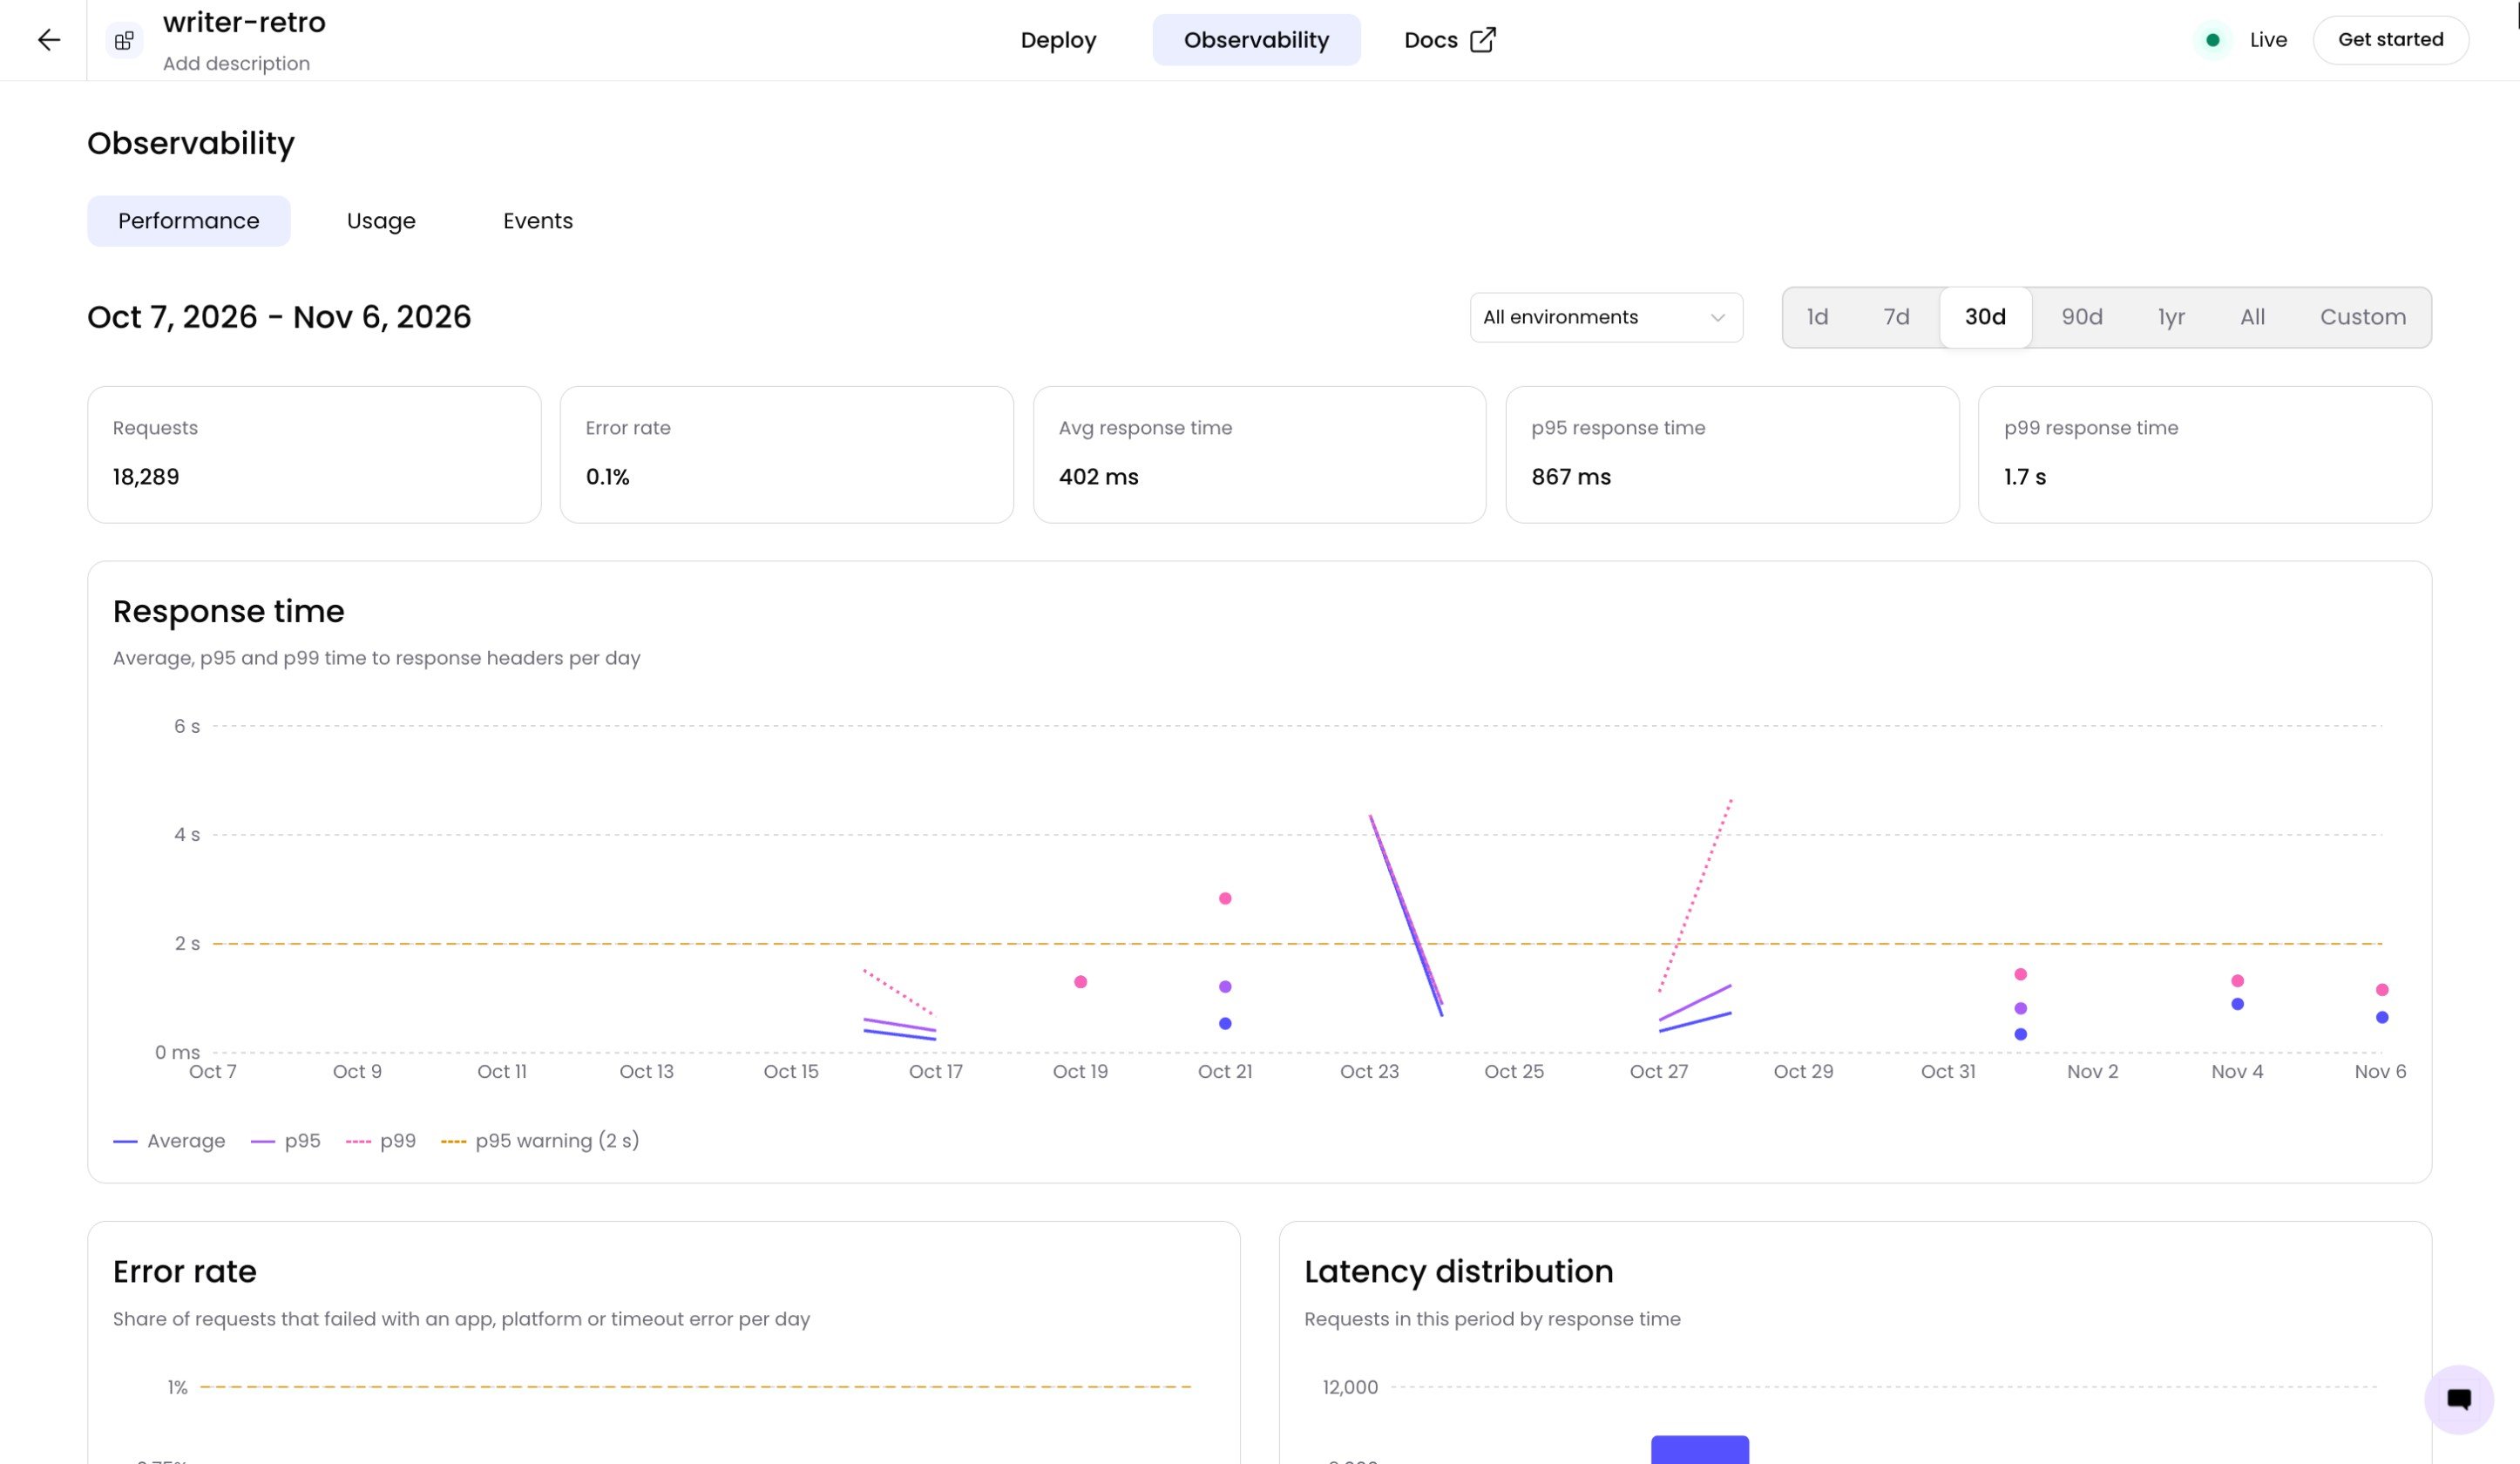
Inspect individual events
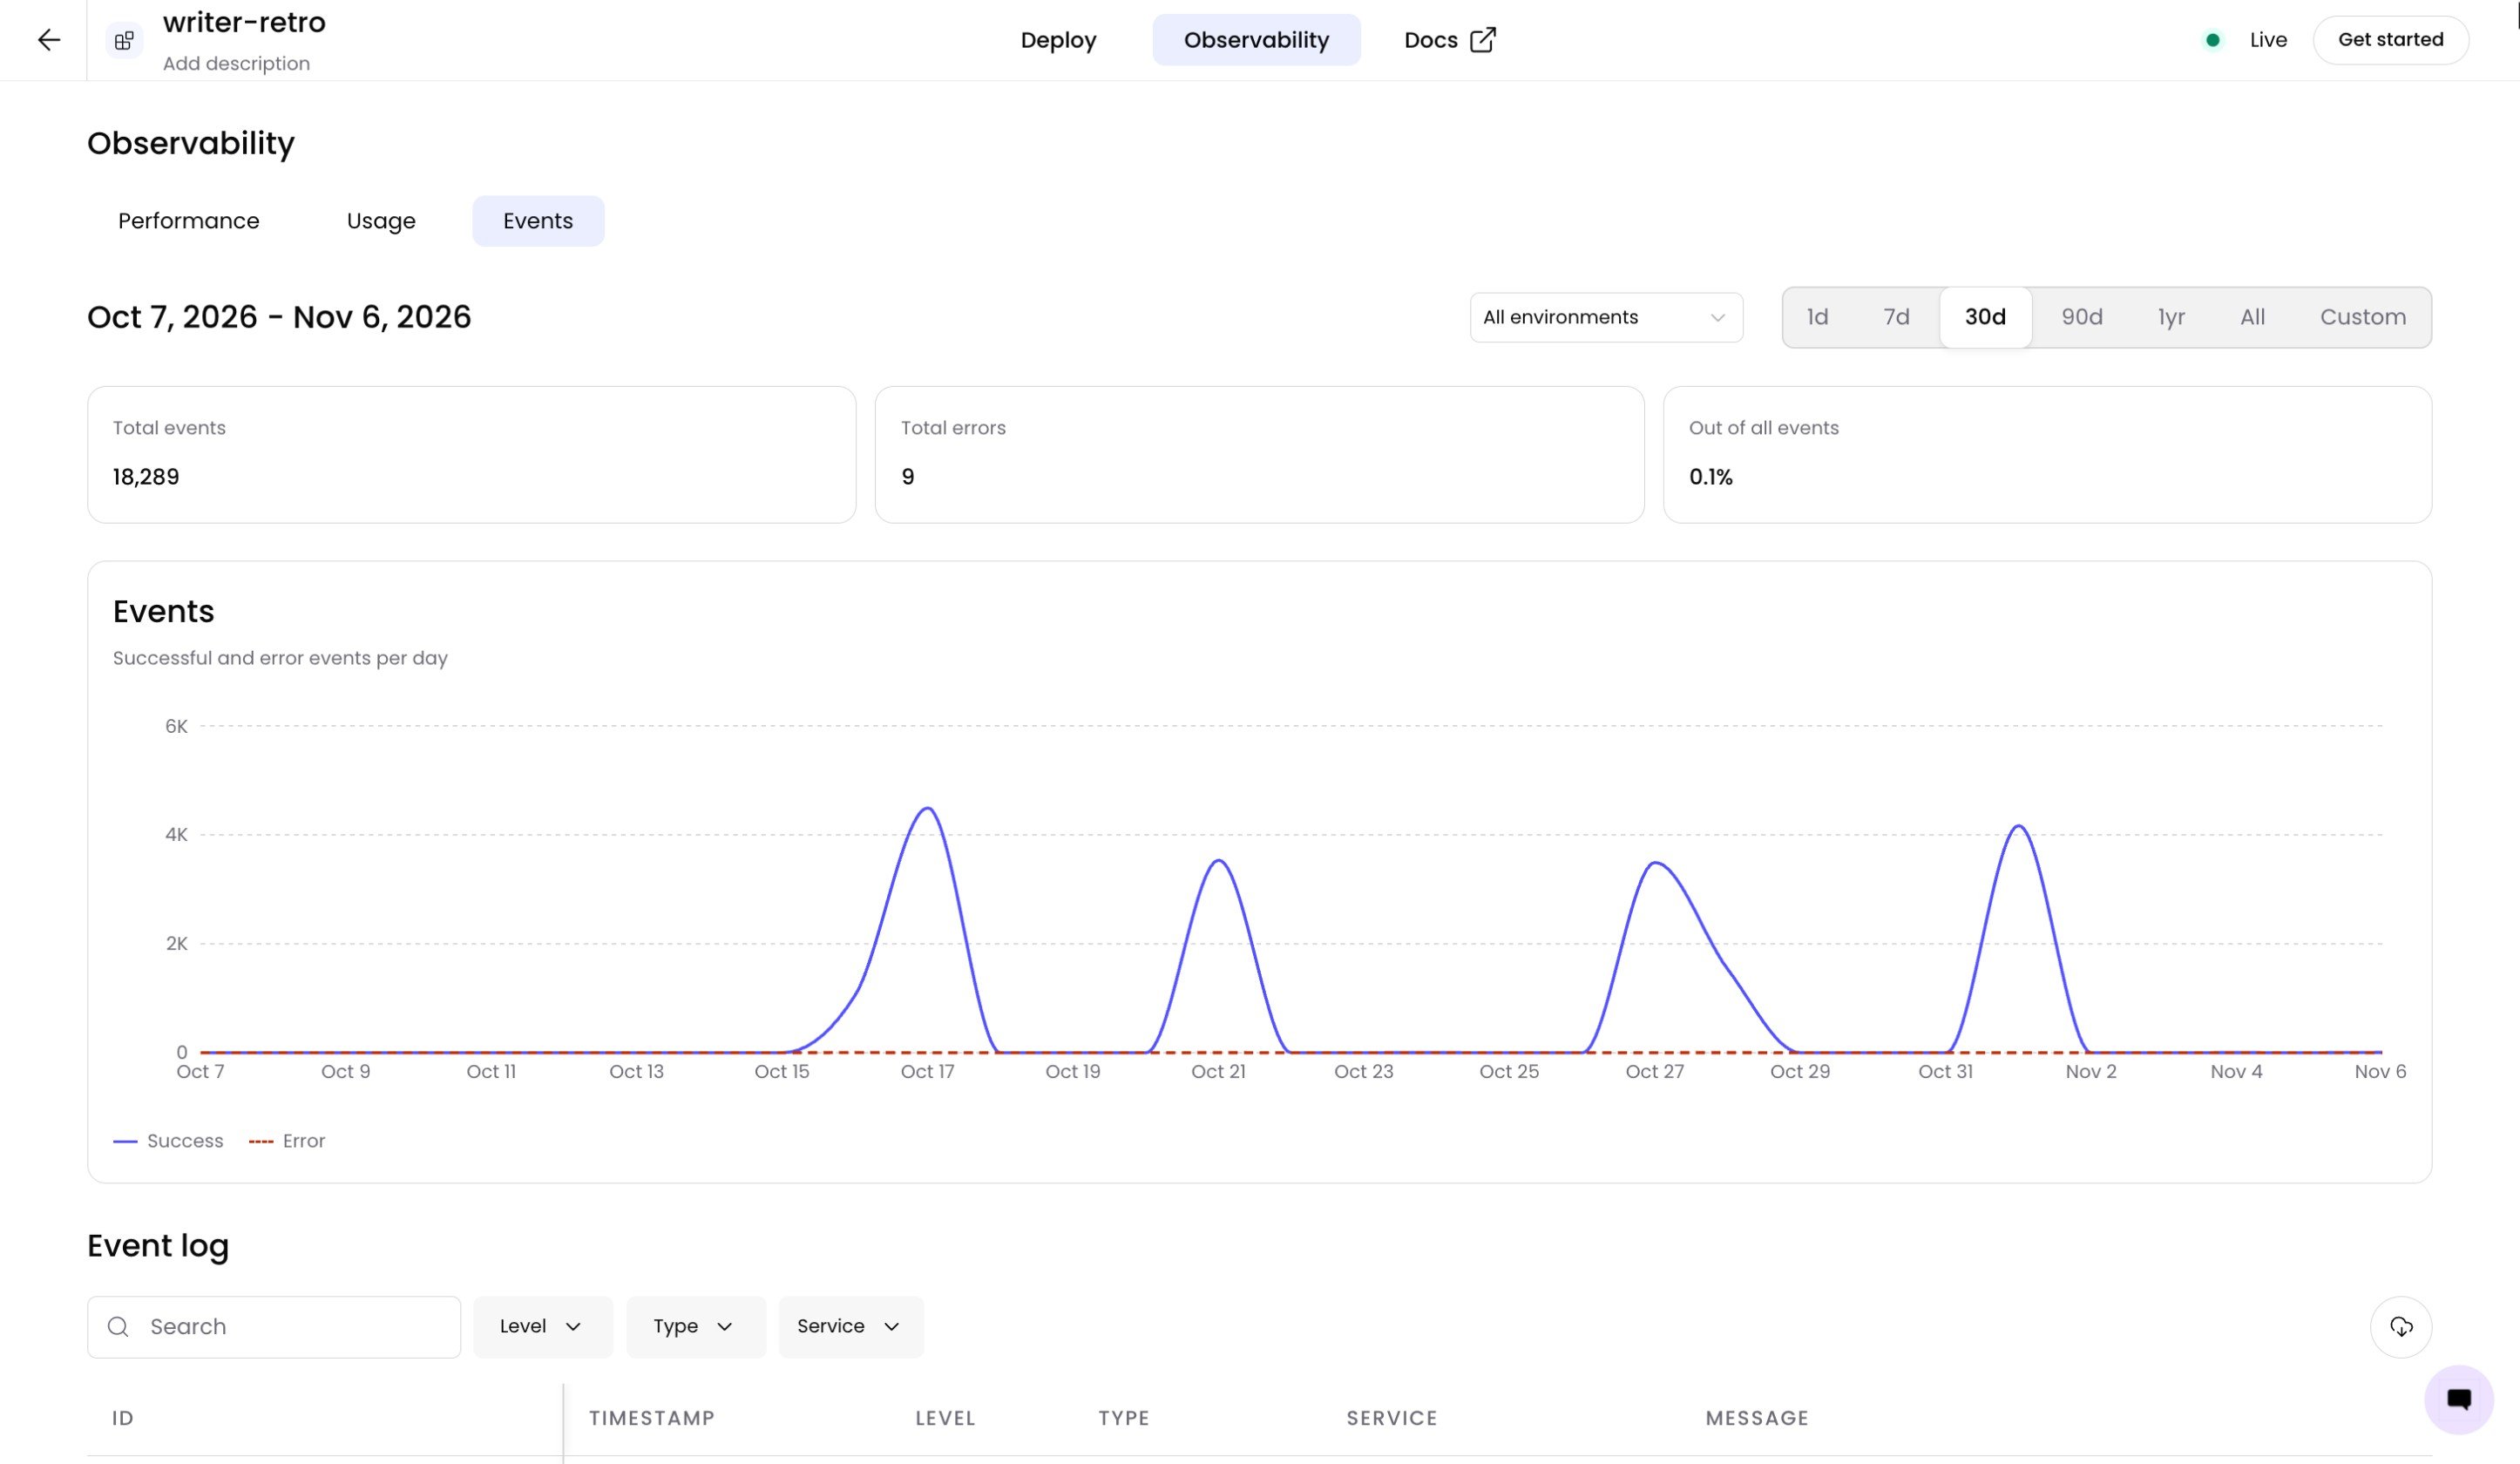
The Events view lists log events from the agent’s container, each with an ID, timestamp, level, type, service, and message. Select a row to see more detail about that event.Agent Builder v2 agent events don’t appear in the AI Studio or Control Center event logs. They’re only visible in the agent’s Observability tab.
Track usage by team and user
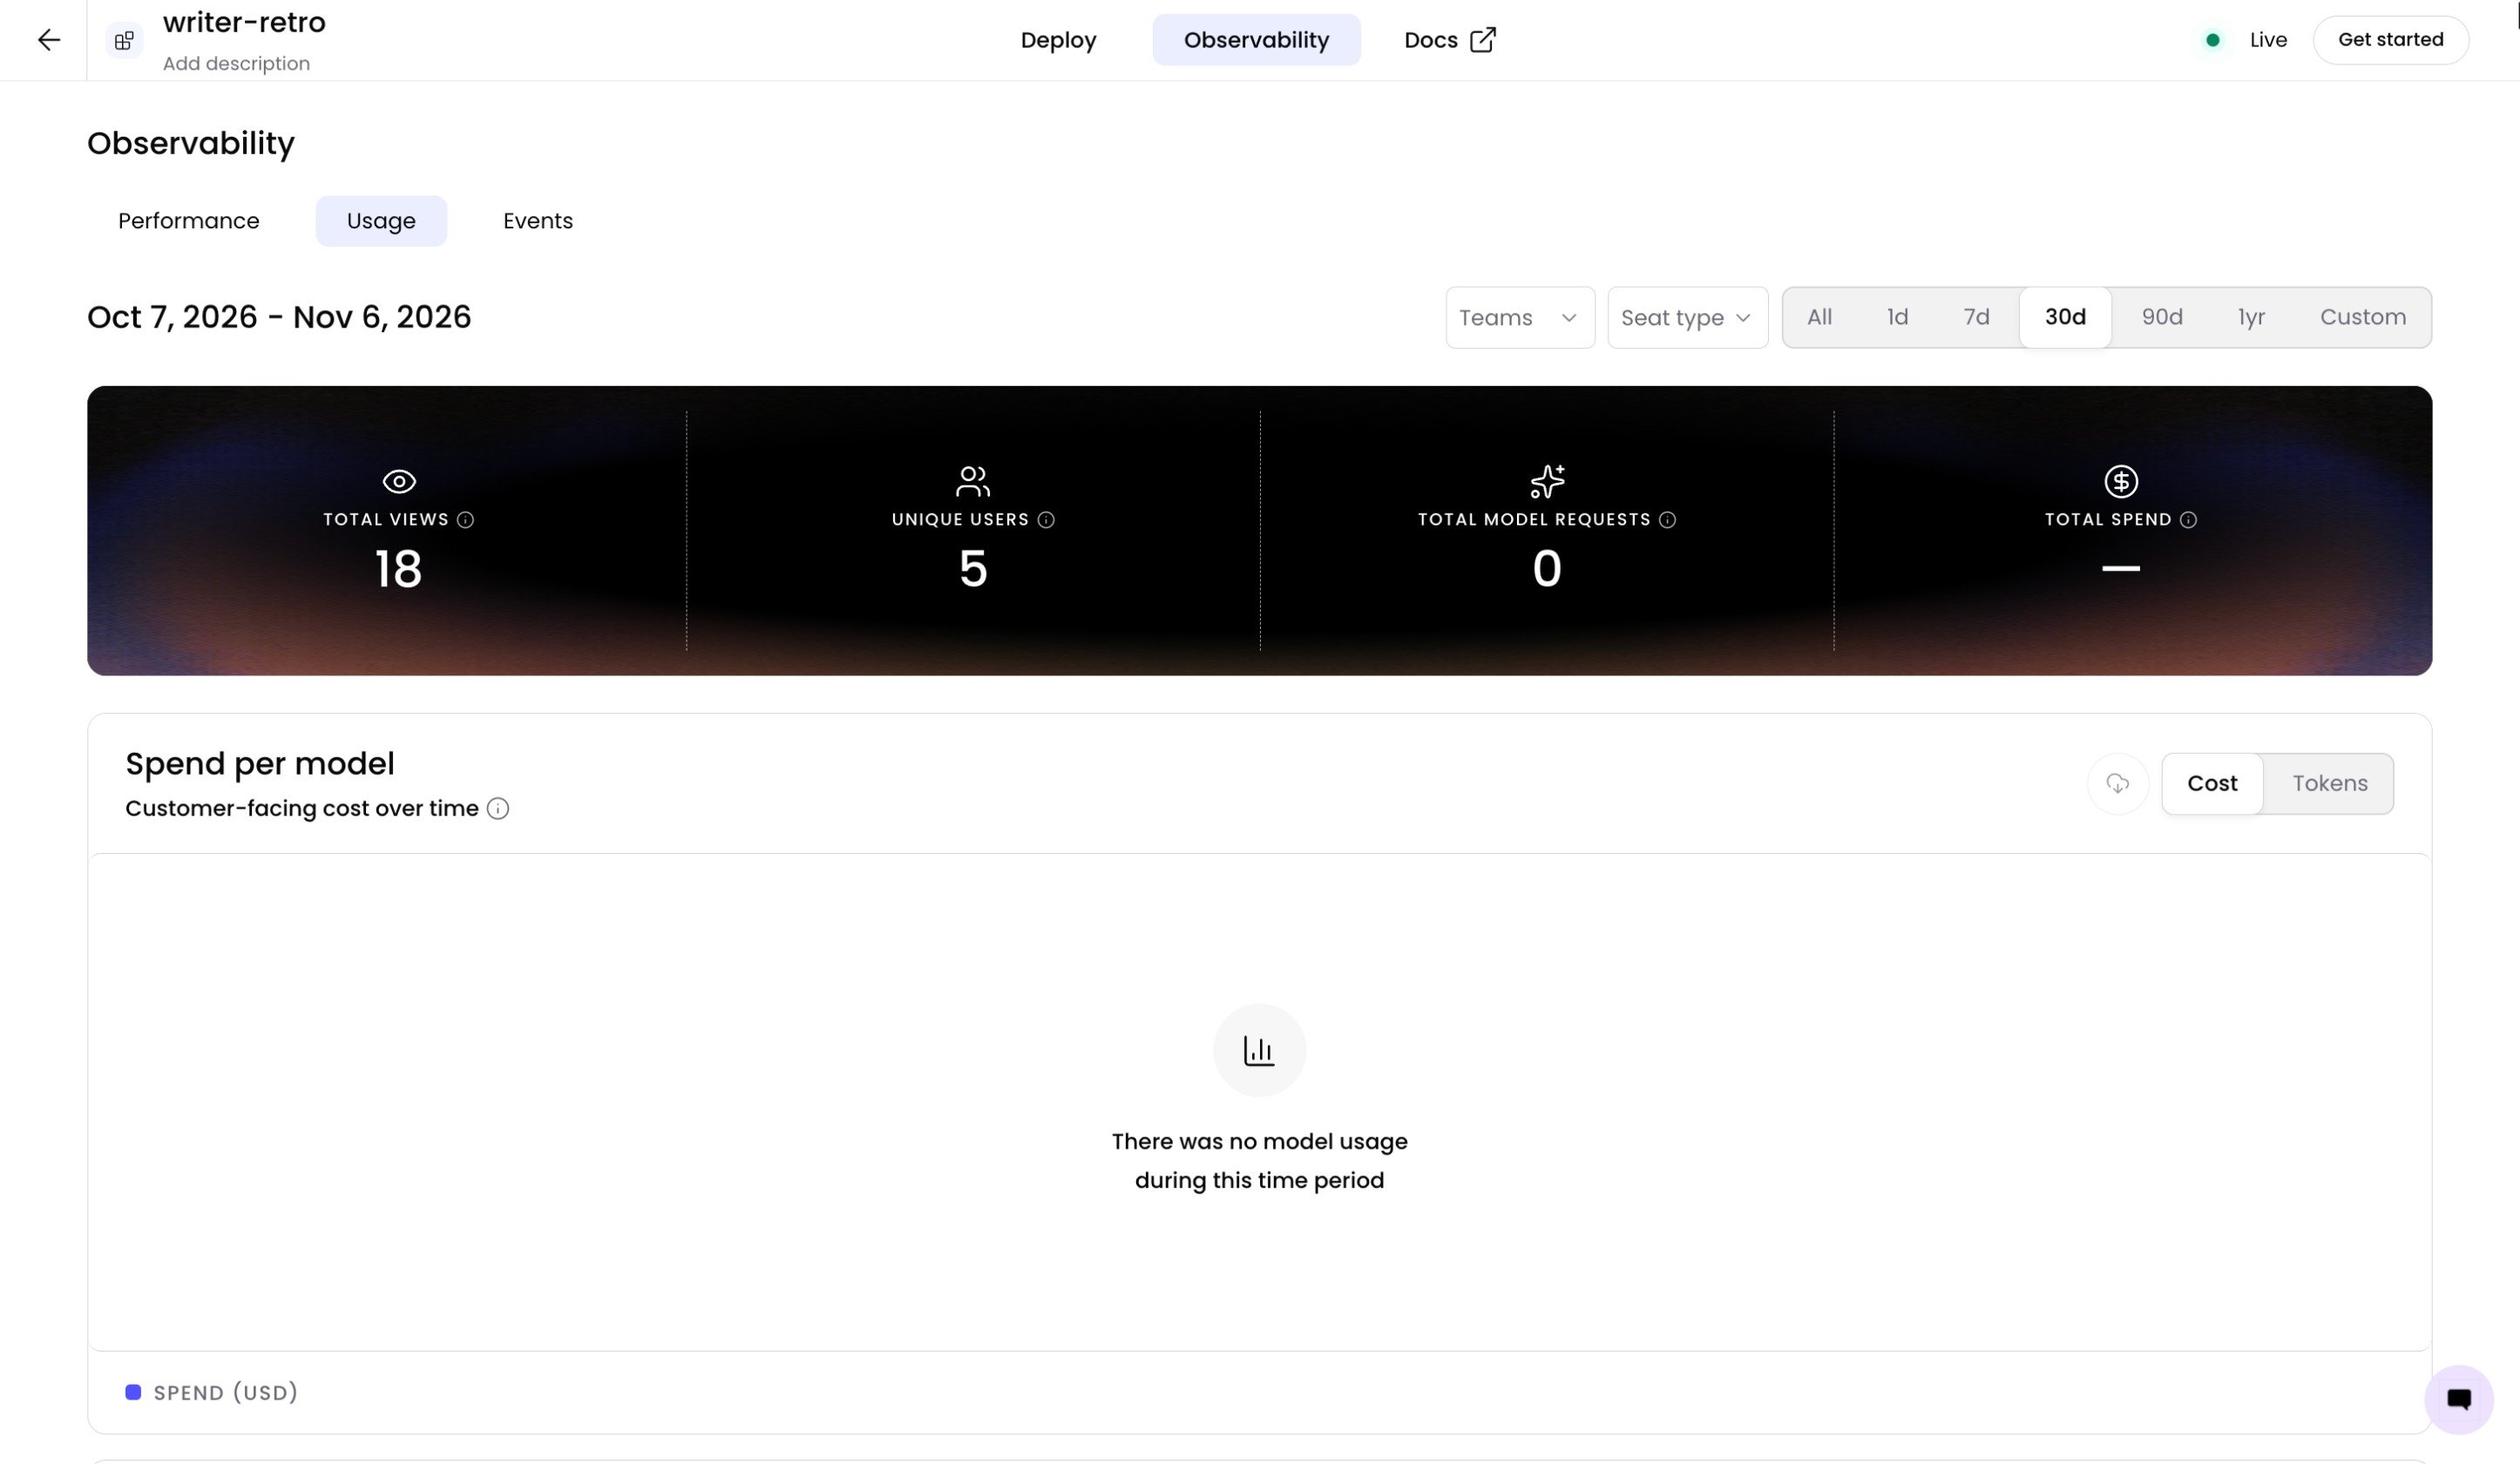
The Usage view shows views, unique users, model requests, and spend for the agent’s production deployment over a selected time range, with spend broken out per model and a table of the top authenticated users.The Usage view only reports on the agent’s production environment. It doesn’t include traffic from staging or other non-production environments.
Tail server and deployment logs
Each environment has its own Logs tab, available from the agent’s Deploy page: select an environment, then select Logs. The logs toggle between two views:- Server—streams output from the running environment, so you can see what your application is printing in real time.
- Deployment—shows per-step build and deploy log lines with timestamps for a snapshot, so you can see exactly where a deployment succeeded or failed.
Next steps
Continue setting up and learning about Agent Builder v2 with these guides.- Get started with Agent Builder v2 to create and deploy an agent.
- Learn about Agent Builder v2 for environments, snapshots, and the promotion flow.
- Review organization-wide observability for captured LLM calls, usage and spend, and export APIs across Control Center.