> ## Documentation Index
> Fetch the complete documentation index at: https://dev.writer.com/llms.txt
> Use this file to discover all available pages before exploring further.
# Datadog Logs plugin
> Send logs and metrics to Datadog for monitoring your AI Studio platform and agents.
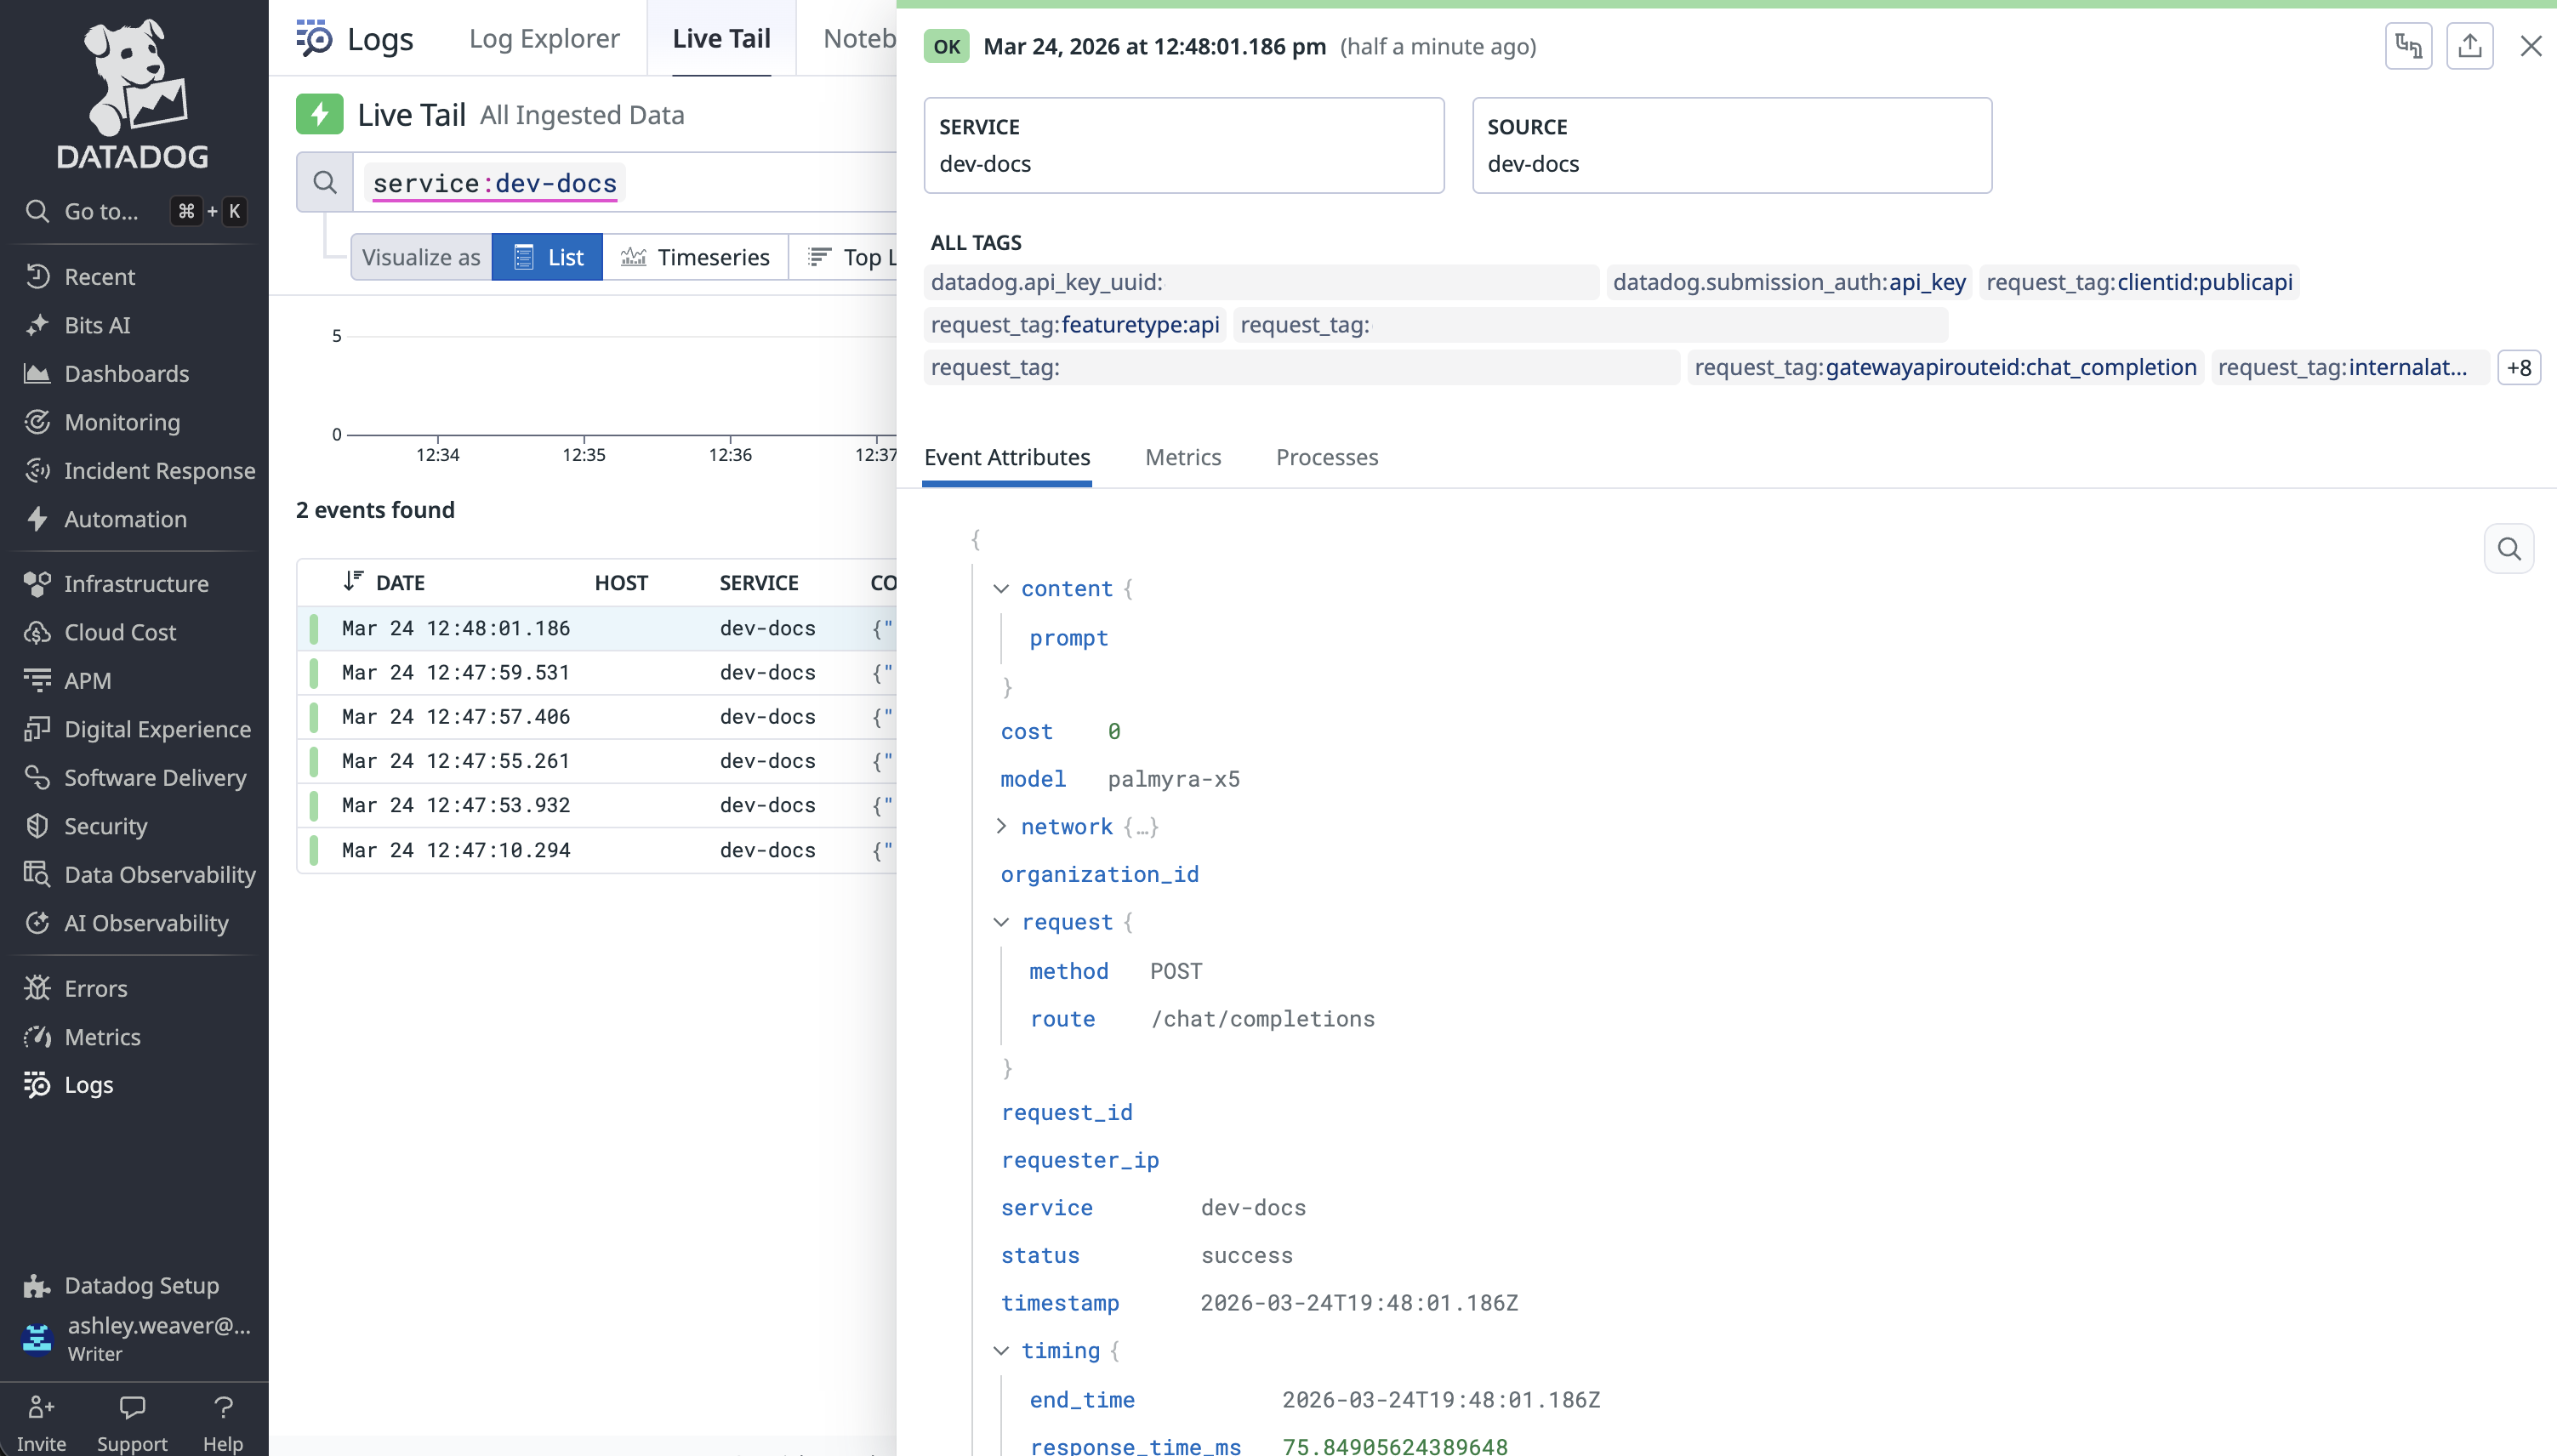
This guide shows you how to configure the [Datadog](https://www.datadoghq.com/) Logs plugin for AI Studio. After setting up this plugin, AI Studio forwards a log event to Datadog for every LLM request. Each log event includes:
* **Model and routing metadata**: The model used and the API route that handled the request
* **Token usage**: Prompt tokens, completion tokens, and total tokens consumed per request
* **Performance data**: Success/failure status, latency, and error details when applicable
* **Cost**: Per-request spend attributed to the organization and model
* **Prompt and response content**: The full prompt and completion text, when available
If [content masking](/home/event-logs#mask-sensitive-content) is enabled in
event logs, prompts and responses forwarded to Datadog are also masked.
 ## Set up the Datadog Logs plugin
Configure the Datadog Logs plugin in [AI Studio](https://app.writer.com/aistudio) under **Plugins**.
### Obtain your Datadog API key
Before configuring the plugin in AI Studio, locate your API key in Datadog:
1. Log in to your [Datadog account](https://app.datadoghq.com/)
2. Navigate to **Organization Settings** → **API Keys**
3. Copy an existing API key or create a new one
For more information on obtaining a Datadog API key, see [Datadog API keys documentation](https://docs.datadoghq.com/account_management/api-app-keys/#api-keys).
### Identify your Datadog site region
Determine which Datadog site your organization uses. The **Site** hostname value controls which regional endpoint receives your logs.
| Region | Site hostname value | Location |
| ------------- | ------------------- | ------------ |
| US1 (default) | `datadoghq.com` | US |
| US3 | `us3.datadoghq.com` | US |
| US5 | `us5.datadoghq.com` | US |
| EU | `datadoghq.eu` | EU (Germany) |
For more information on Datadog regions, see [Datadog regions documentation](https://docs.datadoghq.com/getting_started/site/#access-the-datadog-site).
### Optional: Configure tags
Tags can be a standalone `value` or a `key:value` pair that Datadog attaches to your log events for filtering, aggregating, and grouping logs in dashboards, monitors, and alerts.
The following table shows common tag examples:
| Tag | Purpose |
| ------------------------------ | -------------------------------------- |
| `env:prod` | Identifies the deployment environment |
| `instance:i-1234567890abcdef0` | Identifies a specific host or instance |
| `name:example-name` | Labels the resource by name |
| `managed` | Identifies logs from managed services |
| `writer` | Groups all Writer-related log events |
For more information on tagging requirements and strategies, see the [Datadog tagging documentation](https://docs.datadoghq.com/getting_started/tagging/).
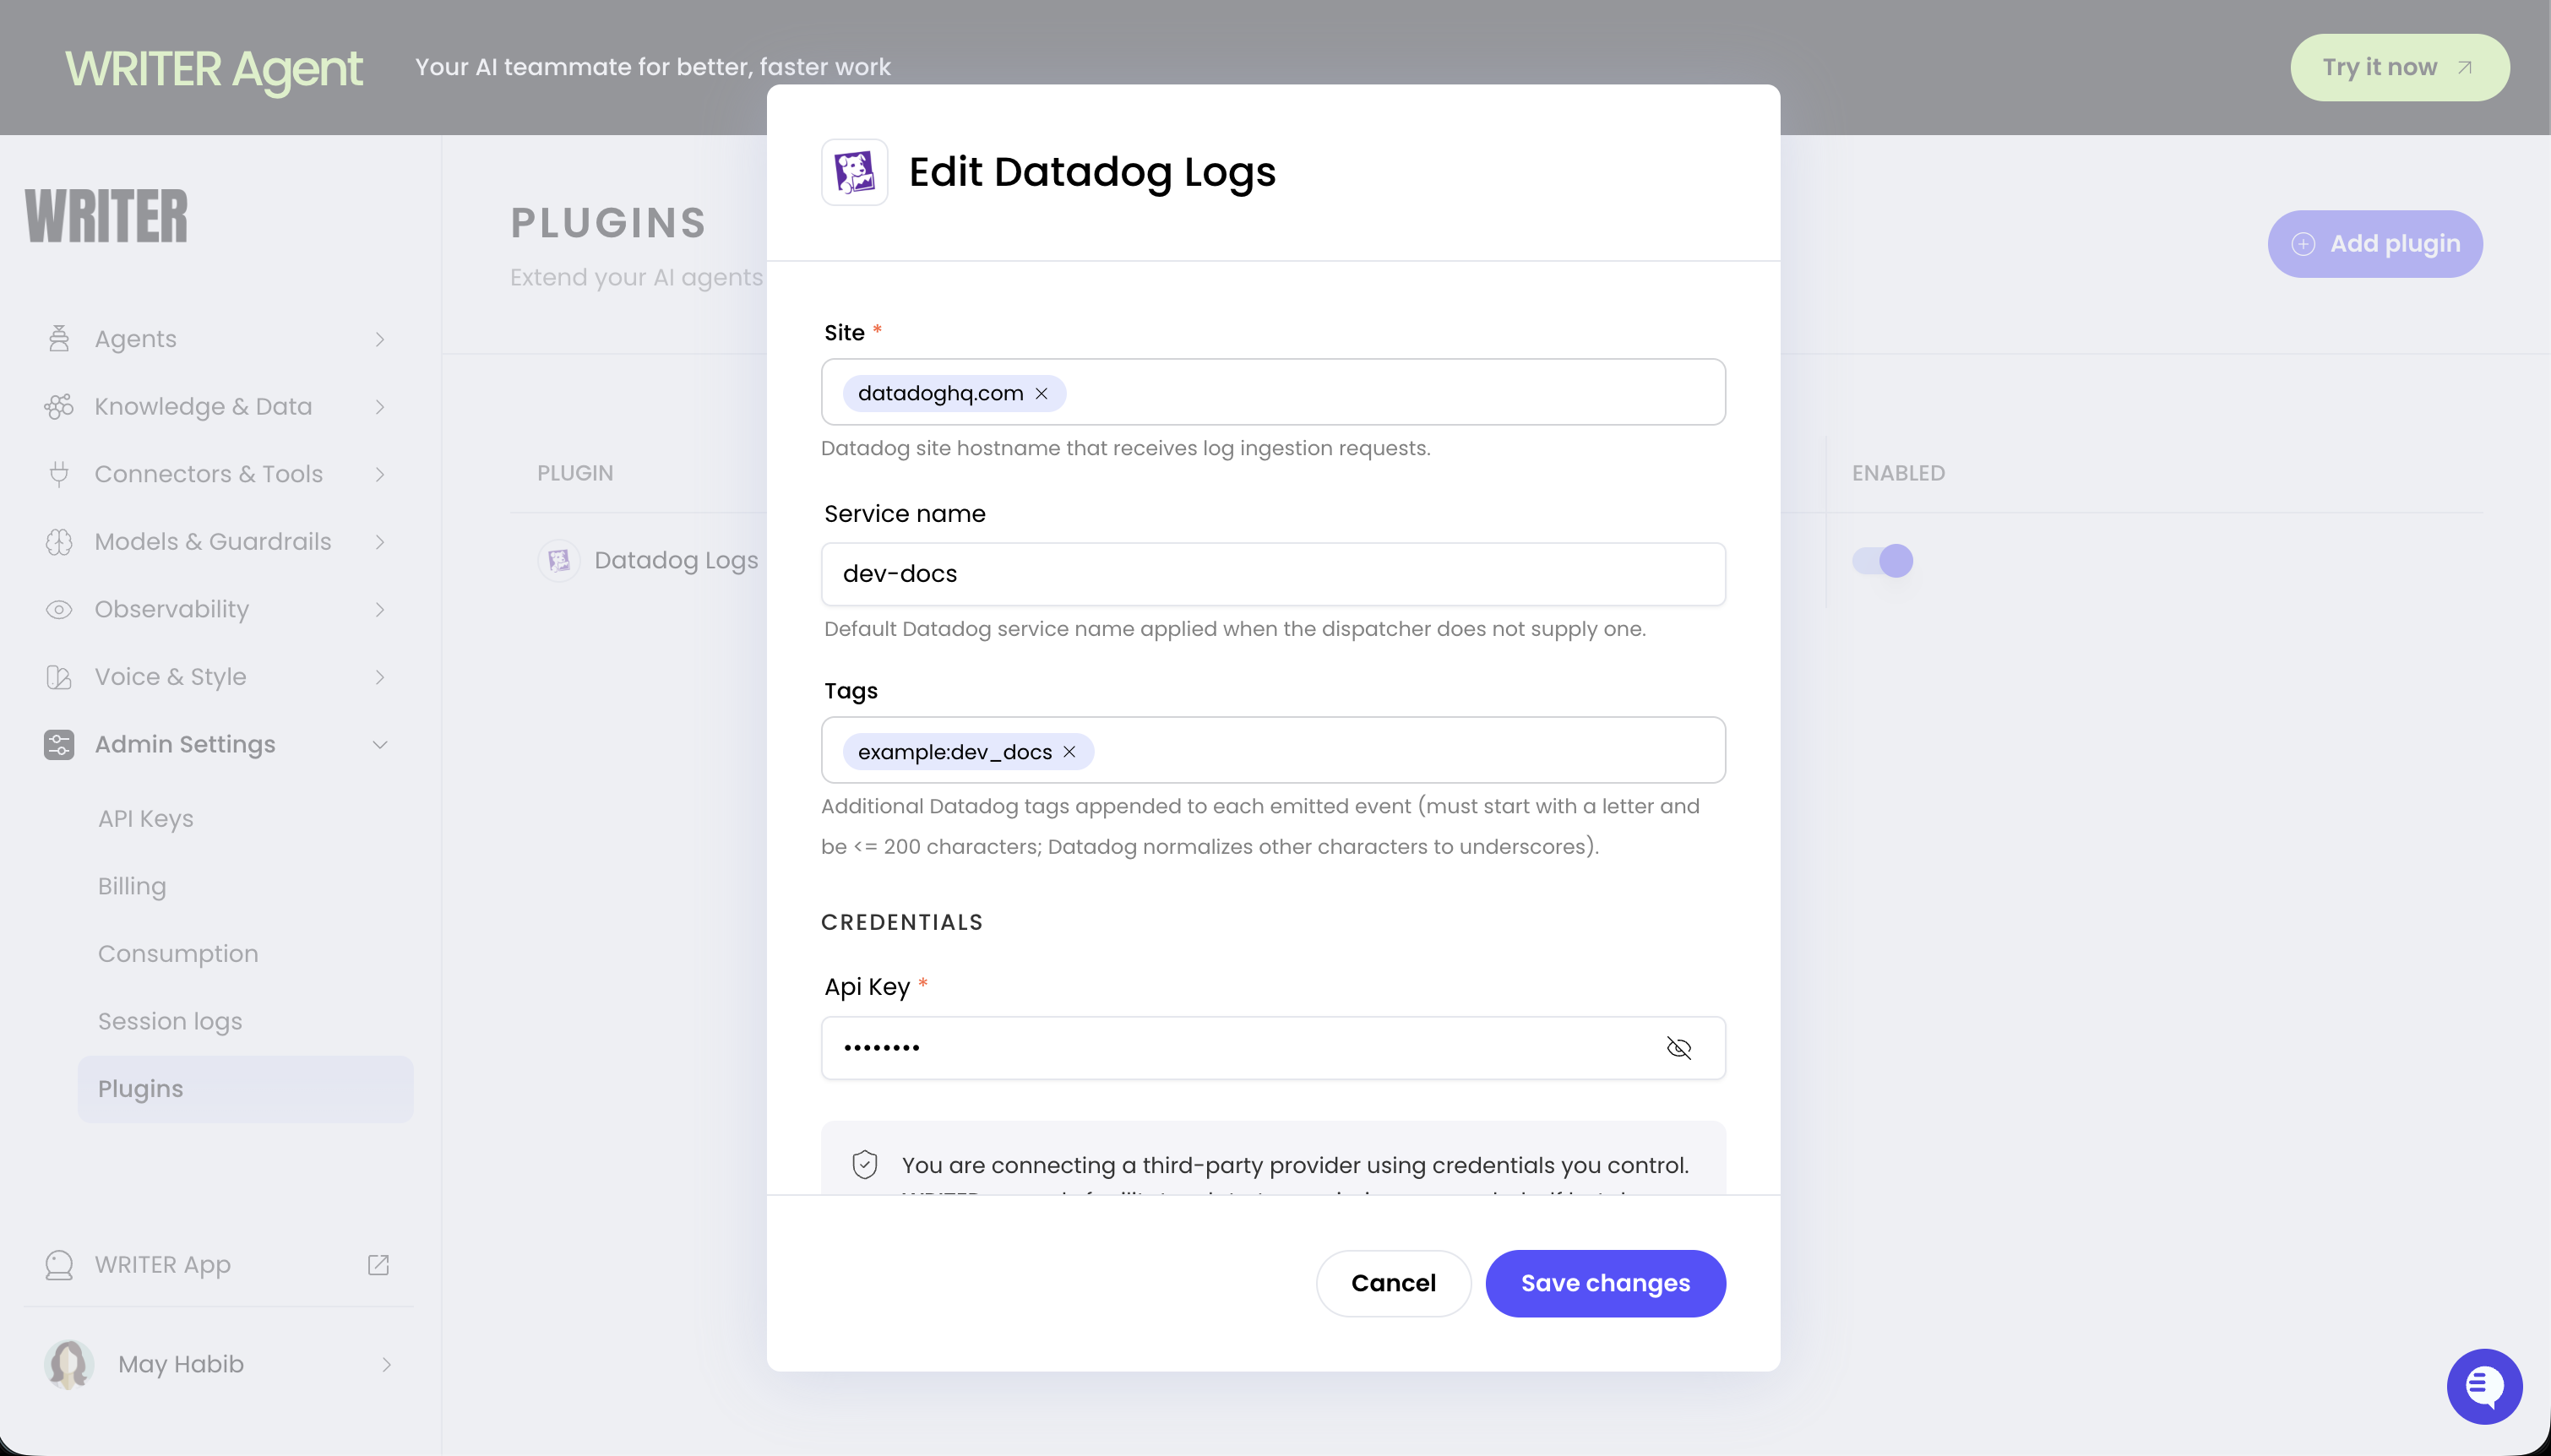
### Configure the plugin in AI Studio
After obtaining your API key and identifying your site region:
1. Navigate to [AI Studio](https://app.writer.com/aistudio)
2. Open the Datadog Logs plugin configuration
3. Enter your configuration values:
| Field | Description | Example |
| --------------- | ---------------------------------------------------------------------------------------------------------------------------------------------------------------------------------------------- | -------------------------------------------------- |
| Service name | A stable, human-readable identifier for the service emitting logs. Maps to the reserved `service` attribute in the log payload. Datadog uses this to group logs and correlate with APM traces. | `writer-agent`, `writer-ai-studio` |
| Site hostname | The Datadog regional intake endpoint. See [supported regions](#identify-your-datadog-site-region). | `datadoghq.com` |
| (Optional) Tags | A list of `key:value` tags applied to every log event. Sent as the reserved `ddtags` attribute in the log payload. See [configure tags](#optional-configure-tags). | `env:prod`, `team:platform`, `component:ai-studio` |
| API key | Your Datadog API key. See [obtain your API key](#obtain-your-datadog-api-key). | Your API key from Datadog |
4. Select **Save** to activate the plugin
## Set up the Datadog Logs plugin
Configure the Datadog Logs plugin in [AI Studio](https://app.writer.com/aistudio) under **Plugins**.
### Obtain your Datadog API key
Before configuring the plugin in AI Studio, locate your API key in Datadog:
1. Log in to your [Datadog account](https://app.datadoghq.com/)
2. Navigate to **Organization Settings** → **API Keys**
3. Copy an existing API key or create a new one
For more information on obtaining a Datadog API key, see [Datadog API keys documentation](https://docs.datadoghq.com/account_management/api-app-keys/#api-keys).
### Identify your Datadog site region
Determine which Datadog site your organization uses. The **Site** hostname value controls which regional endpoint receives your logs.
| Region | Site hostname value | Location |
| ------------- | ------------------- | ------------ |
| US1 (default) | `datadoghq.com` | US |
| US3 | `us3.datadoghq.com` | US |
| US5 | `us5.datadoghq.com` | US |
| EU | `datadoghq.eu` | EU (Germany) |
For more information on Datadog regions, see [Datadog regions documentation](https://docs.datadoghq.com/getting_started/site/#access-the-datadog-site).
### Optional: Configure tags
Tags can be a standalone `value` or a `key:value` pair that Datadog attaches to your log events for filtering, aggregating, and grouping logs in dashboards, monitors, and alerts.
The following table shows common tag examples:
| Tag | Purpose |
| ------------------------------ | -------------------------------------- |
| `env:prod` | Identifies the deployment environment |
| `instance:i-1234567890abcdef0` | Identifies a specific host or instance |
| `name:example-name` | Labels the resource by name |
| `managed` | Identifies logs from managed services |
| `writer` | Groups all Writer-related log events |
For more information on tagging requirements and strategies, see the [Datadog tagging documentation](https://docs.datadoghq.com/getting_started/tagging/).
### Configure the plugin in AI Studio
After obtaining your API key and identifying your site region:
1. Navigate to [AI Studio](https://app.writer.com/aistudio)
2. Open the Datadog Logs plugin configuration
3. Enter your configuration values:
| Field | Description | Example |
| --------------- | ---------------------------------------------------------------------------------------------------------------------------------------------------------------------------------------------- | -------------------------------------------------- |
| Service name | A stable, human-readable identifier for the service emitting logs. Maps to the reserved `service` attribute in the log payload. Datadog uses this to group logs and correlate with APM traces. | `writer-agent`, `writer-ai-studio` |
| Site hostname | The Datadog regional intake endpoint. See [supported regions](#identify-your-datadog-site-region). | `datadoghq.com` |
| (Optional) Tags | A list of `key:value` tags applied to every log event. Sent as the reserved `ddtags` attribute in the log payload. See [configure tags](#optional-configure-tags). | `env:prod`, `team:platform`, `component:ai-studio` |
| API key | Your Datadog API key. See [obtain your API key](#obtain-your-datadog-api-key). | Your API key from Datadog |
4. Select **Save** to activate the plugin
 After saving, AI Studio begins forwarding log events to Datadog. Open the [Datadog Logs Explorer](https://app.datadoghq.com/logs) to verify that events are arriving, then build dashboards, monitors, and alerts around the data.
## Next steps
* [Observability overview](/home/observability): Monitor events, errors, and performance across your deployment
* [Agent observability](/home/agent-observability): Track individual agent performance with session logs and metrics
* [Configure plugins](/home/plugins-overview): Manage plugins across your organization
After saving, AI Studio begins forwarding log events to Datadog. Open the [Datadog Logs Explorer](https://app.datadoghq.com/logs) to verify that events are arriving, then build dashboards, monitors, and alerts around the data.
## Next steps
* [Observability overview](/home/observability): Monitor events, errors, and performance across your deployment
* [Agent observability](/home/agent-observability): Track individual agent performance with session logs and metrics
* [Configure plugins](/home/plugins-overview): Manage plugins across your organization