> ## Documentation Index
> Fetch the complete documentation index at: https://dev.writer.com/llms.txt
> Use this file to discover all available pages before exploring further.
# Troubleshoot common issues
This page provides troubleshooting suggestions for debugging and observing your agents as you build them.
* [Track an agent's progress through a blueprint](#view-progress-through-a-blueprint)
* [View error and info logs](#view-error-and-info-logs)
* [Add additional log messages](#add-additional-logs)
* [View traces from a block's execution](#view-traces)
* [Inspect an agent's state](#inspect-agent-state)
* [Observe agent usage and performance](#observe-agent-usage-and-performance)
## View progress through a blueprint
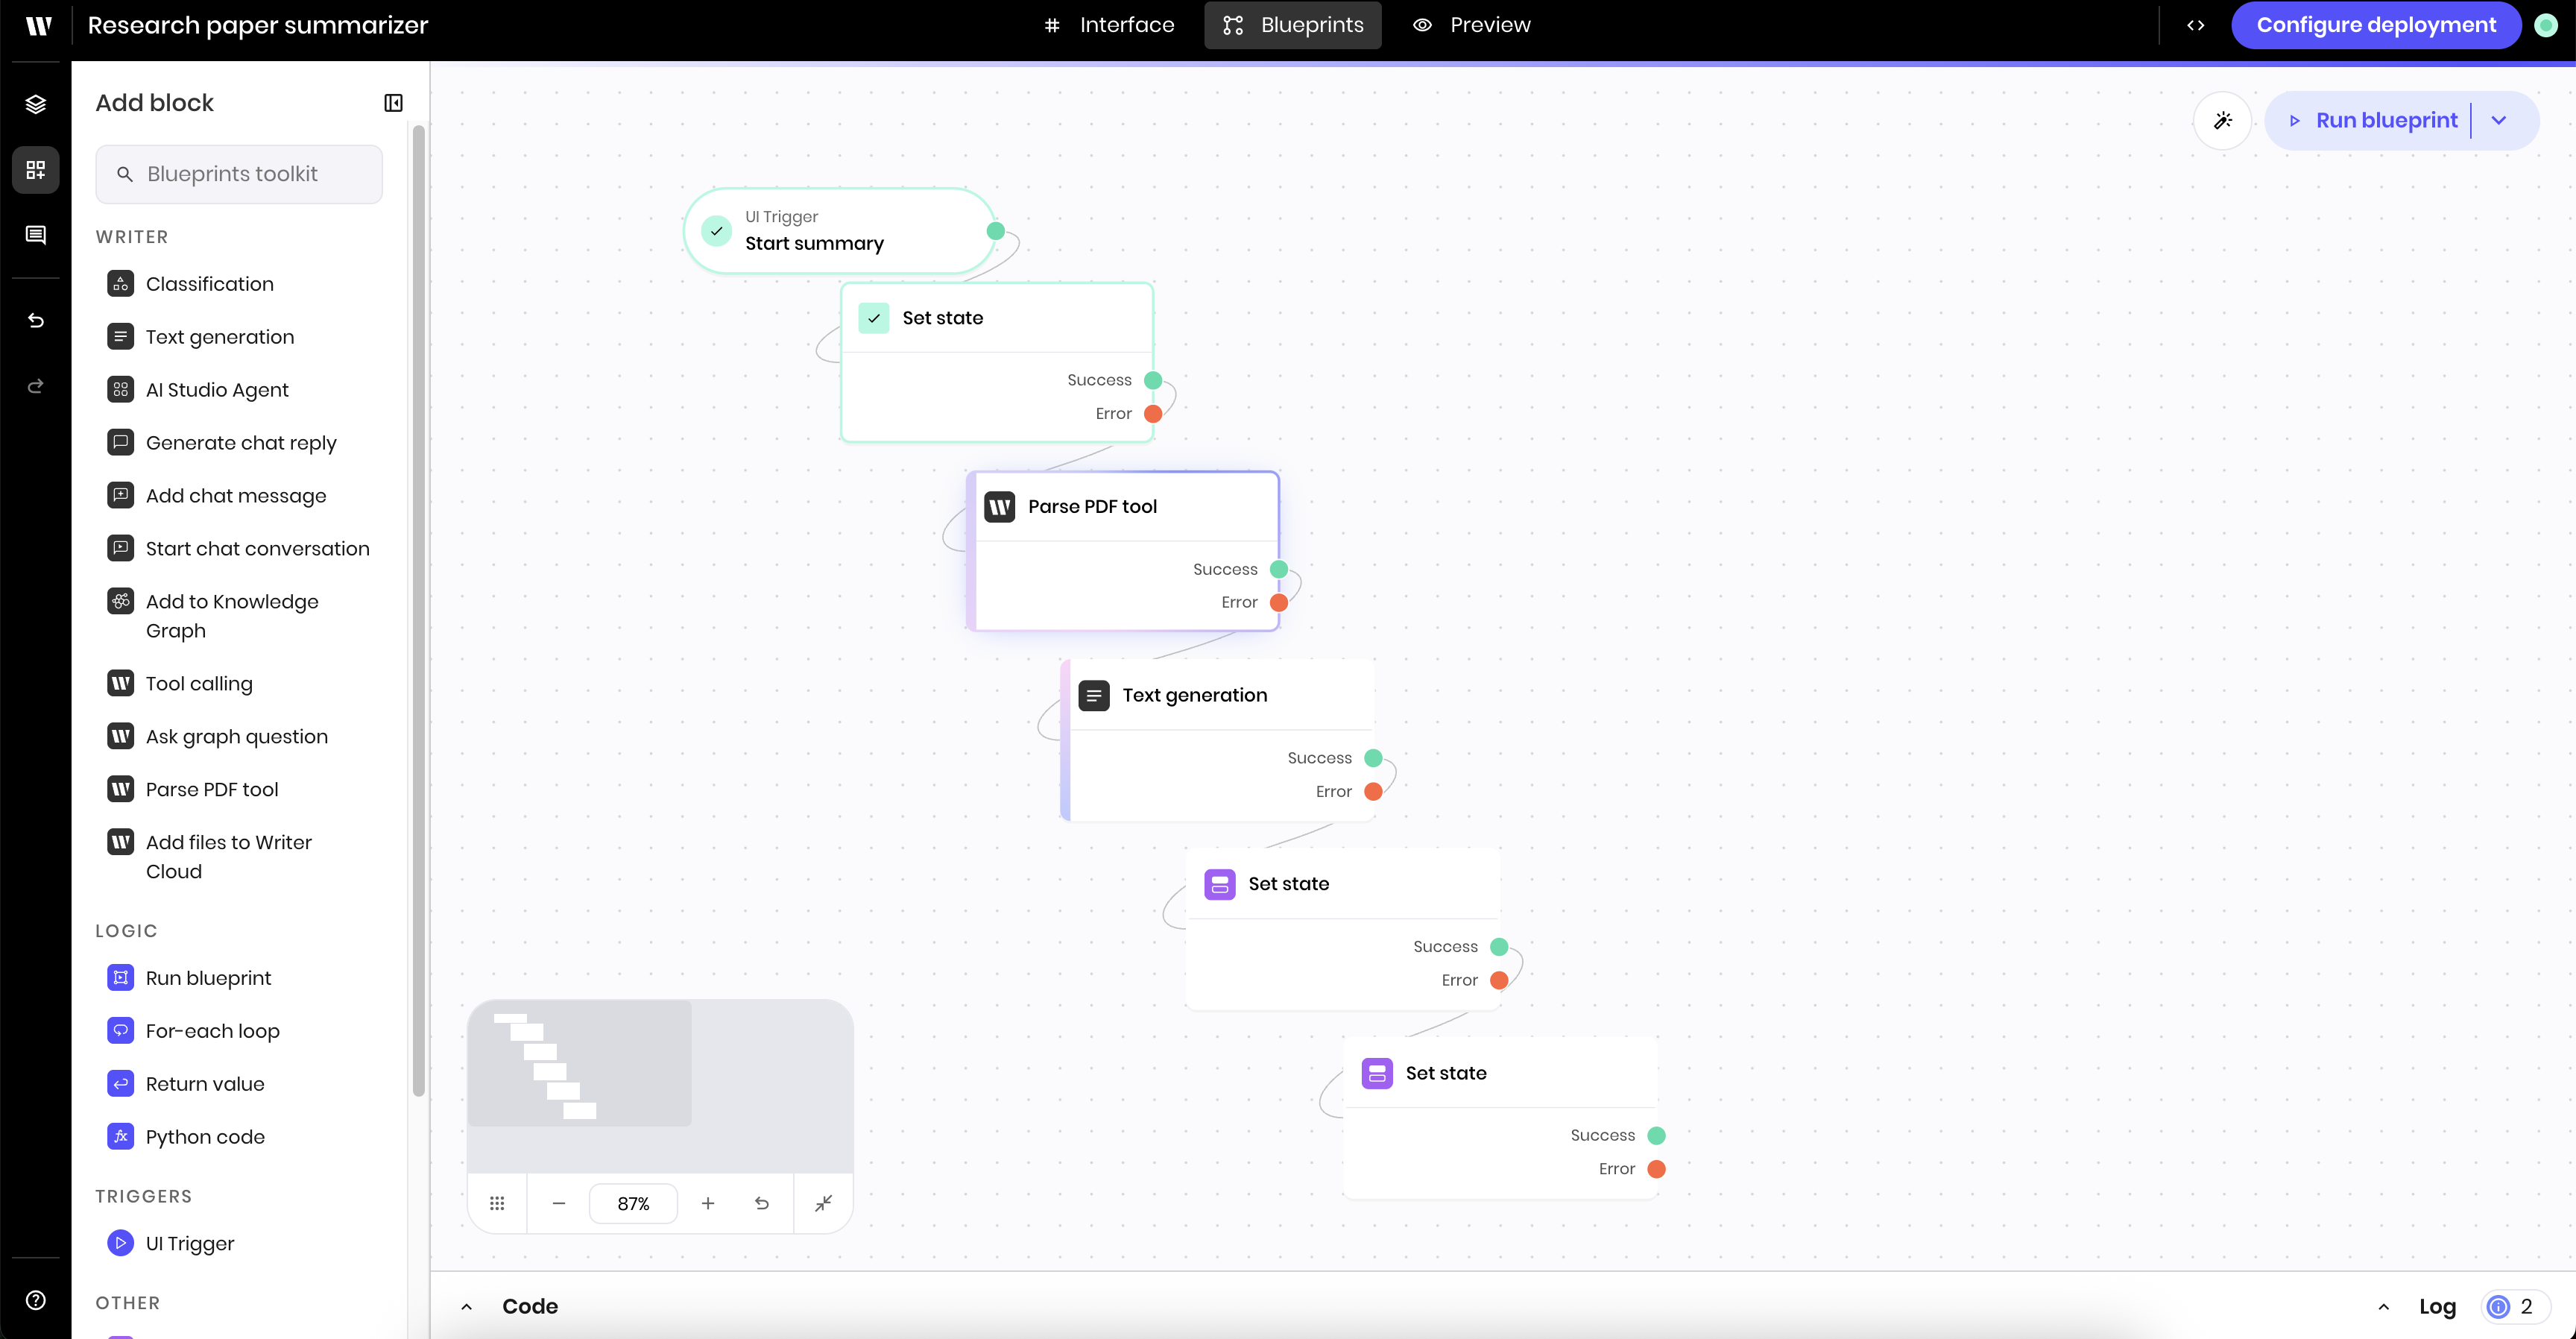
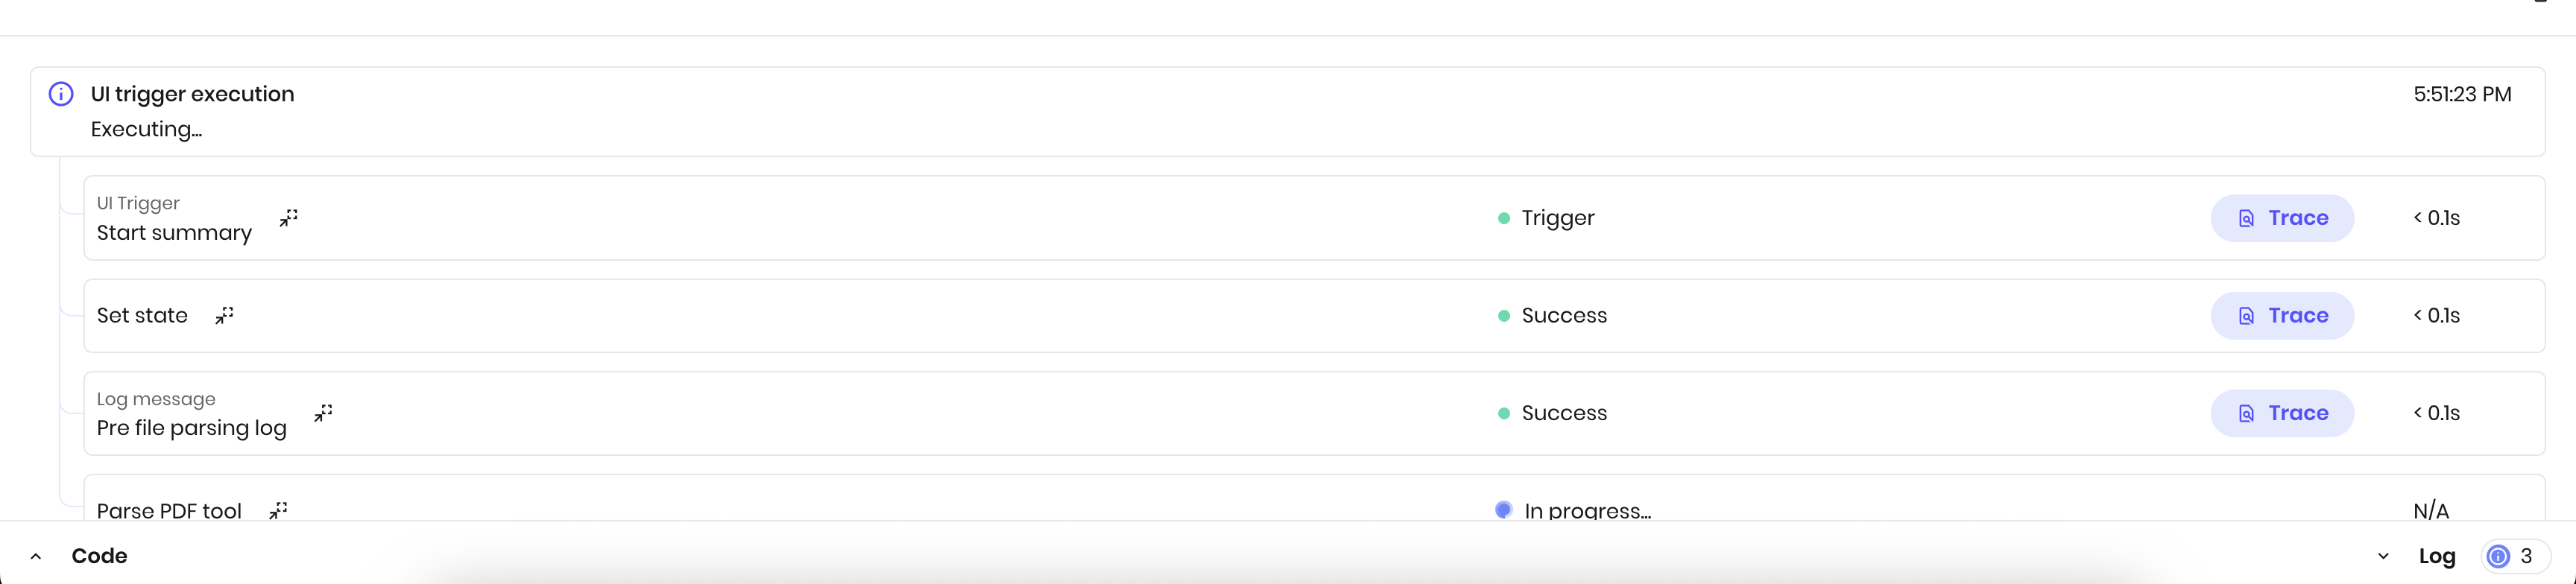
Some blocks such as PDF parsing and text generation can take a while to run. As an agent runs, you can view its progress through the blueprint by navigating to the **Blueprint** tab.
The color of a blueprint block's border describes the status of its execution.
* **Green**: The block completed successfully
* **Animated blue**: The block is currently running
* **Red**: The block failed
* **No border**: The block hasn't run yet
The following image shows a blueprint with a PDF parsing block that's currently running. The previous blocks have completed successfully and the following blocks haven't run yet.
 You can also see the progress of the agent in the **Log** status bar. Learn more below.
## View error and info logs
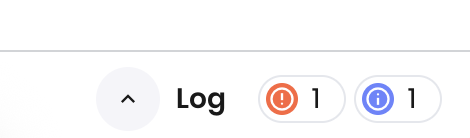
If there are any errors or messages as your agent runs, you'll see an indication in the **Log** bar in the bottom right corner of the page.
You can click the **Log** bar to expand it and see more details.
You can also see the progress of the agent in the **Log** status bar. Learn more below.
## View error and info logs
If there are any errors or messages as your agent runs, you'll see an indication in the **Log** bar in the bottom right corner of the page.
You can click the **Log** bar to expand it and see more details.
 ### Add additional logs with Log Message blocks
You can add additional custom [**Log message** blocks](/blueprints/logmessage) to the agent for debugging purposes. Log messages are helpful to understand the flow of the agent and the value of state and other variables at a given point in the execution.
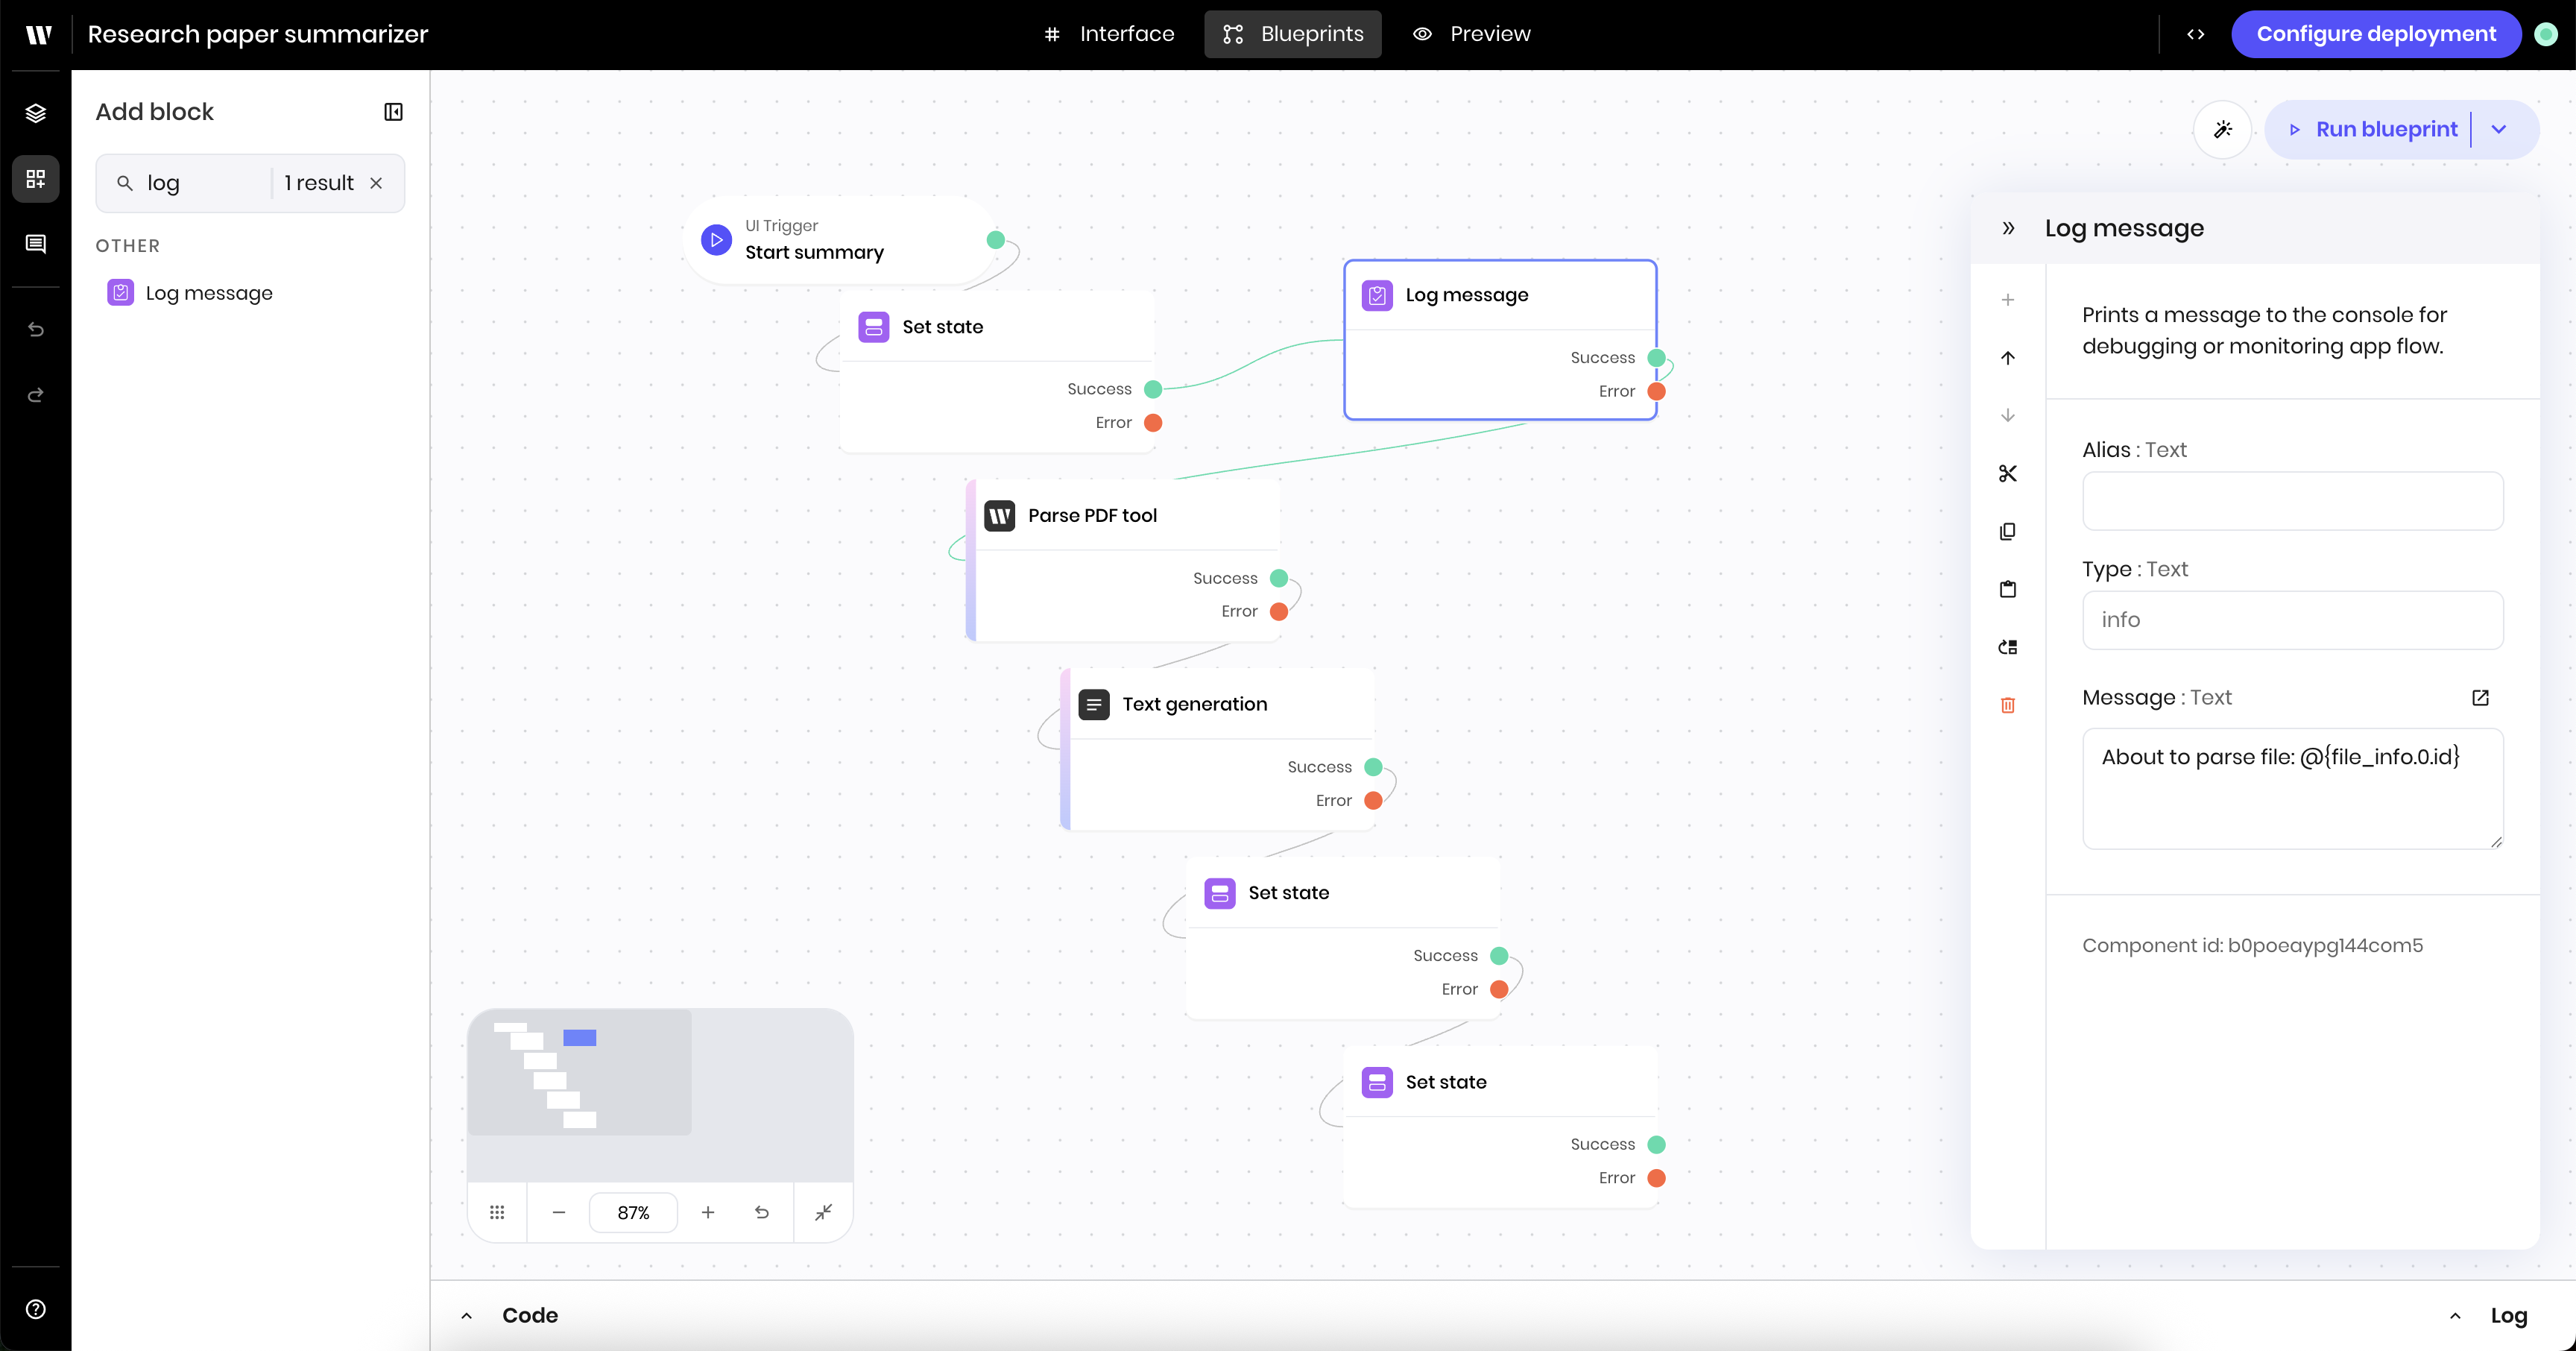
To add a log message, add a **Log message** block to the canvas. In the block's configuration panel, update the following fields:
* **Type**: `info` or `error`
* **Message**: The message to log
Below is an example of a log message block during a file parsing process. It logs the file ID before beginning the parsing process, to help you debug if the file isn't found or isn't parsed correctly.
### Add additional logs with Log Message blocks
You can add additional custom [**Log message** blocks](/blueprints/logmessage) to the agent for debugging purposes. Log messages are helpful to understand the flow of the agent and the value of state and other variables at a given point in the execution.
To add a log message, add a **Log message** block to the canvas. In the block's configuration panel, update the following fields:
* **Type**: `info` or `error`
* **Message**: The message to log
Below is an example of a log message block during a file parsing process. It logs the file ID before beginning the parsing process, to help you debug if the file isn't found or isn't parsed correctly.
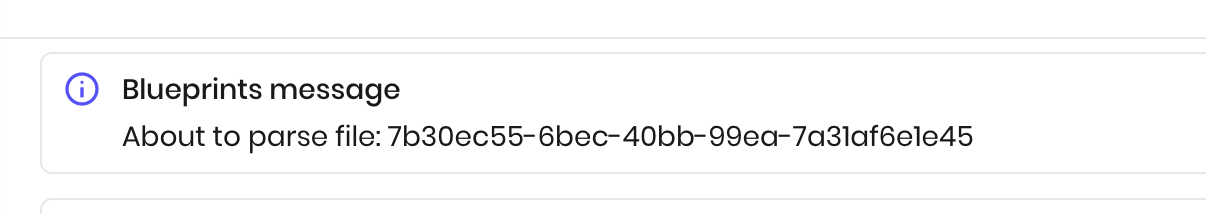
 When the block runs, you'll see the log message in the **Logs** bar at the bottom of the page.
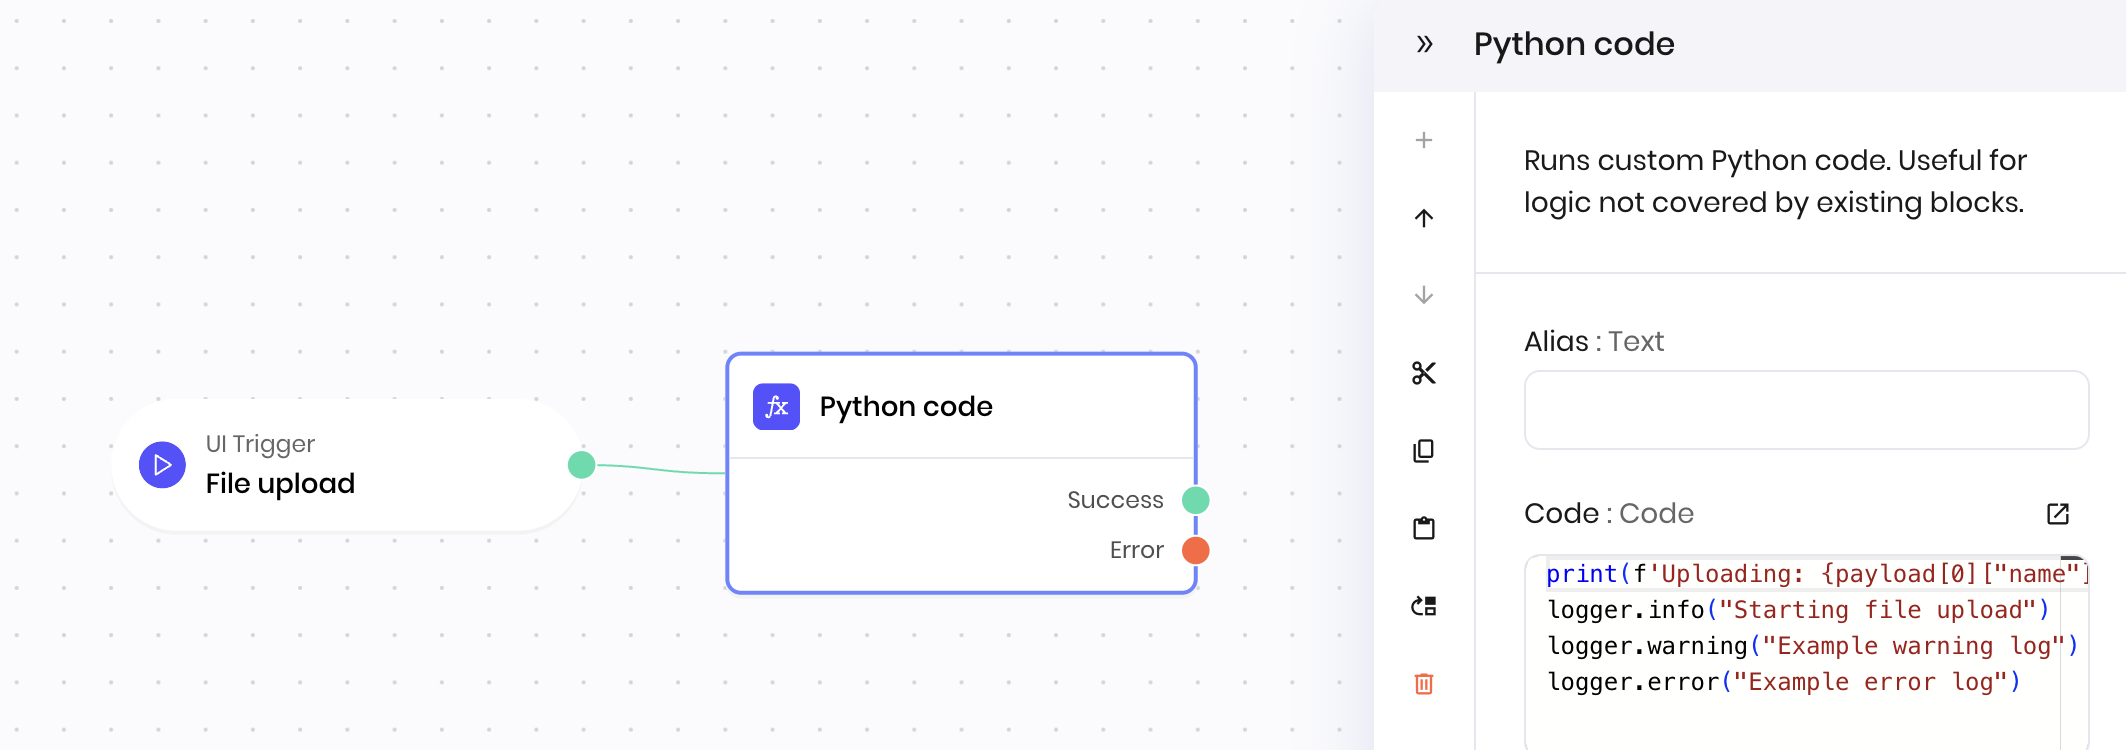
 ### Add additional logs with Python code
You can use python `print` statements and the globally available [`logger` object](https://docs.python.org/3/library/logging.html) to add additional logs to the agent.
```python theme={null}
print("This is a log message that shows in logs as 'Captured stdout'")
logger.info("This is an info message that shows in logs under 'Captured logs'")
logger.warning("This is a warning message that shows in logs under 'Captured logs'")
logger.error("This is an error message that shows in logs under 'Captured logs'")
```
The following image shows an example of a Python block that logs messages via print statements and the `logger` object.
### Add additional logs with Python code
You can use python `print` statements and the globally available [`logger` object](https://docs.python.org/3/library/logging.html) to add additional logs to the agent.
```python theme={null}
print("This is a log message that shows in logs as 'Captured stdout'")
logger.info("This is an info message that shows in logs under 'Captured logs'")
logger.warning("This is a warning message that shows in logs under 'Captured logs'")
logger.error("This is an error message that shows in logs under 'Captured logs'")
```
The following image shows an example of a Python block that logs messages via print statements and the `logger` object.
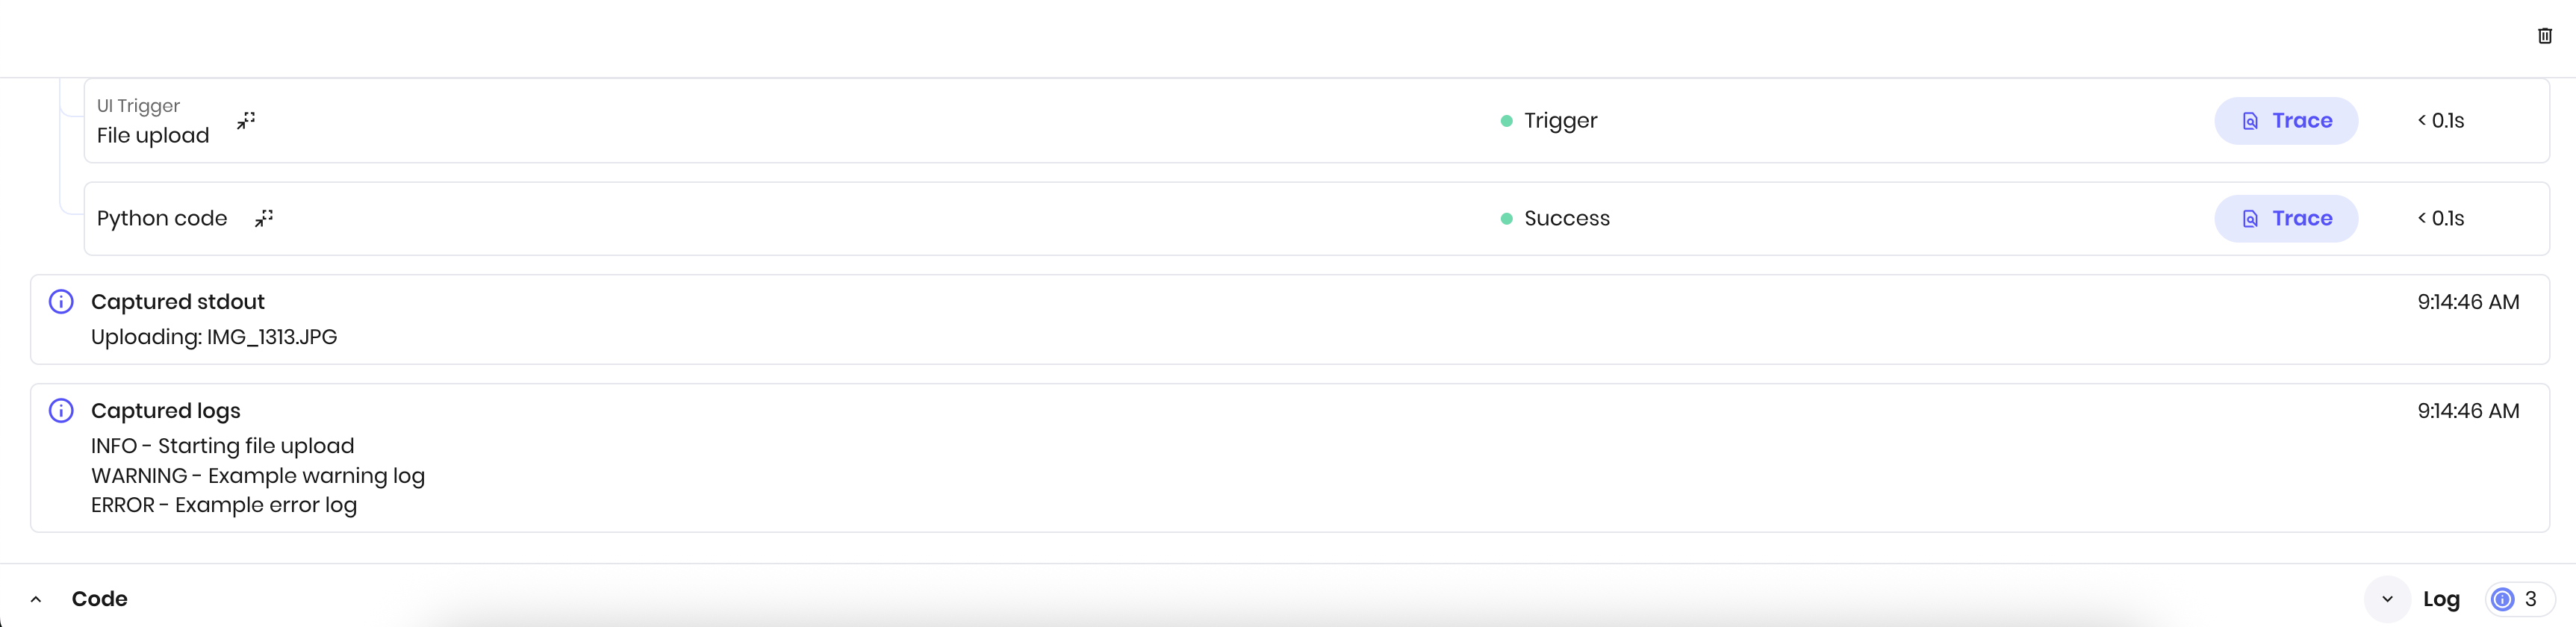
 When the block runs, the log messages appear in the **Logs** bar at the bottom of the page.
 ## View traces
The log bar shows information about the agent's execution as it runs and after blocks complete. It includes the following:
* The block name
* The status of the block: success, error, or in progress
* A link to view a trace at that point in the execution
* How long the block took to run
## View traces
The log bar shows information about the agent's execution as it runs and after blocks complete. It includes the following:
* The block name
* The status of the block: success, error, or in progress
* A link to view a trace at that point in the execution
* How long the block took to run
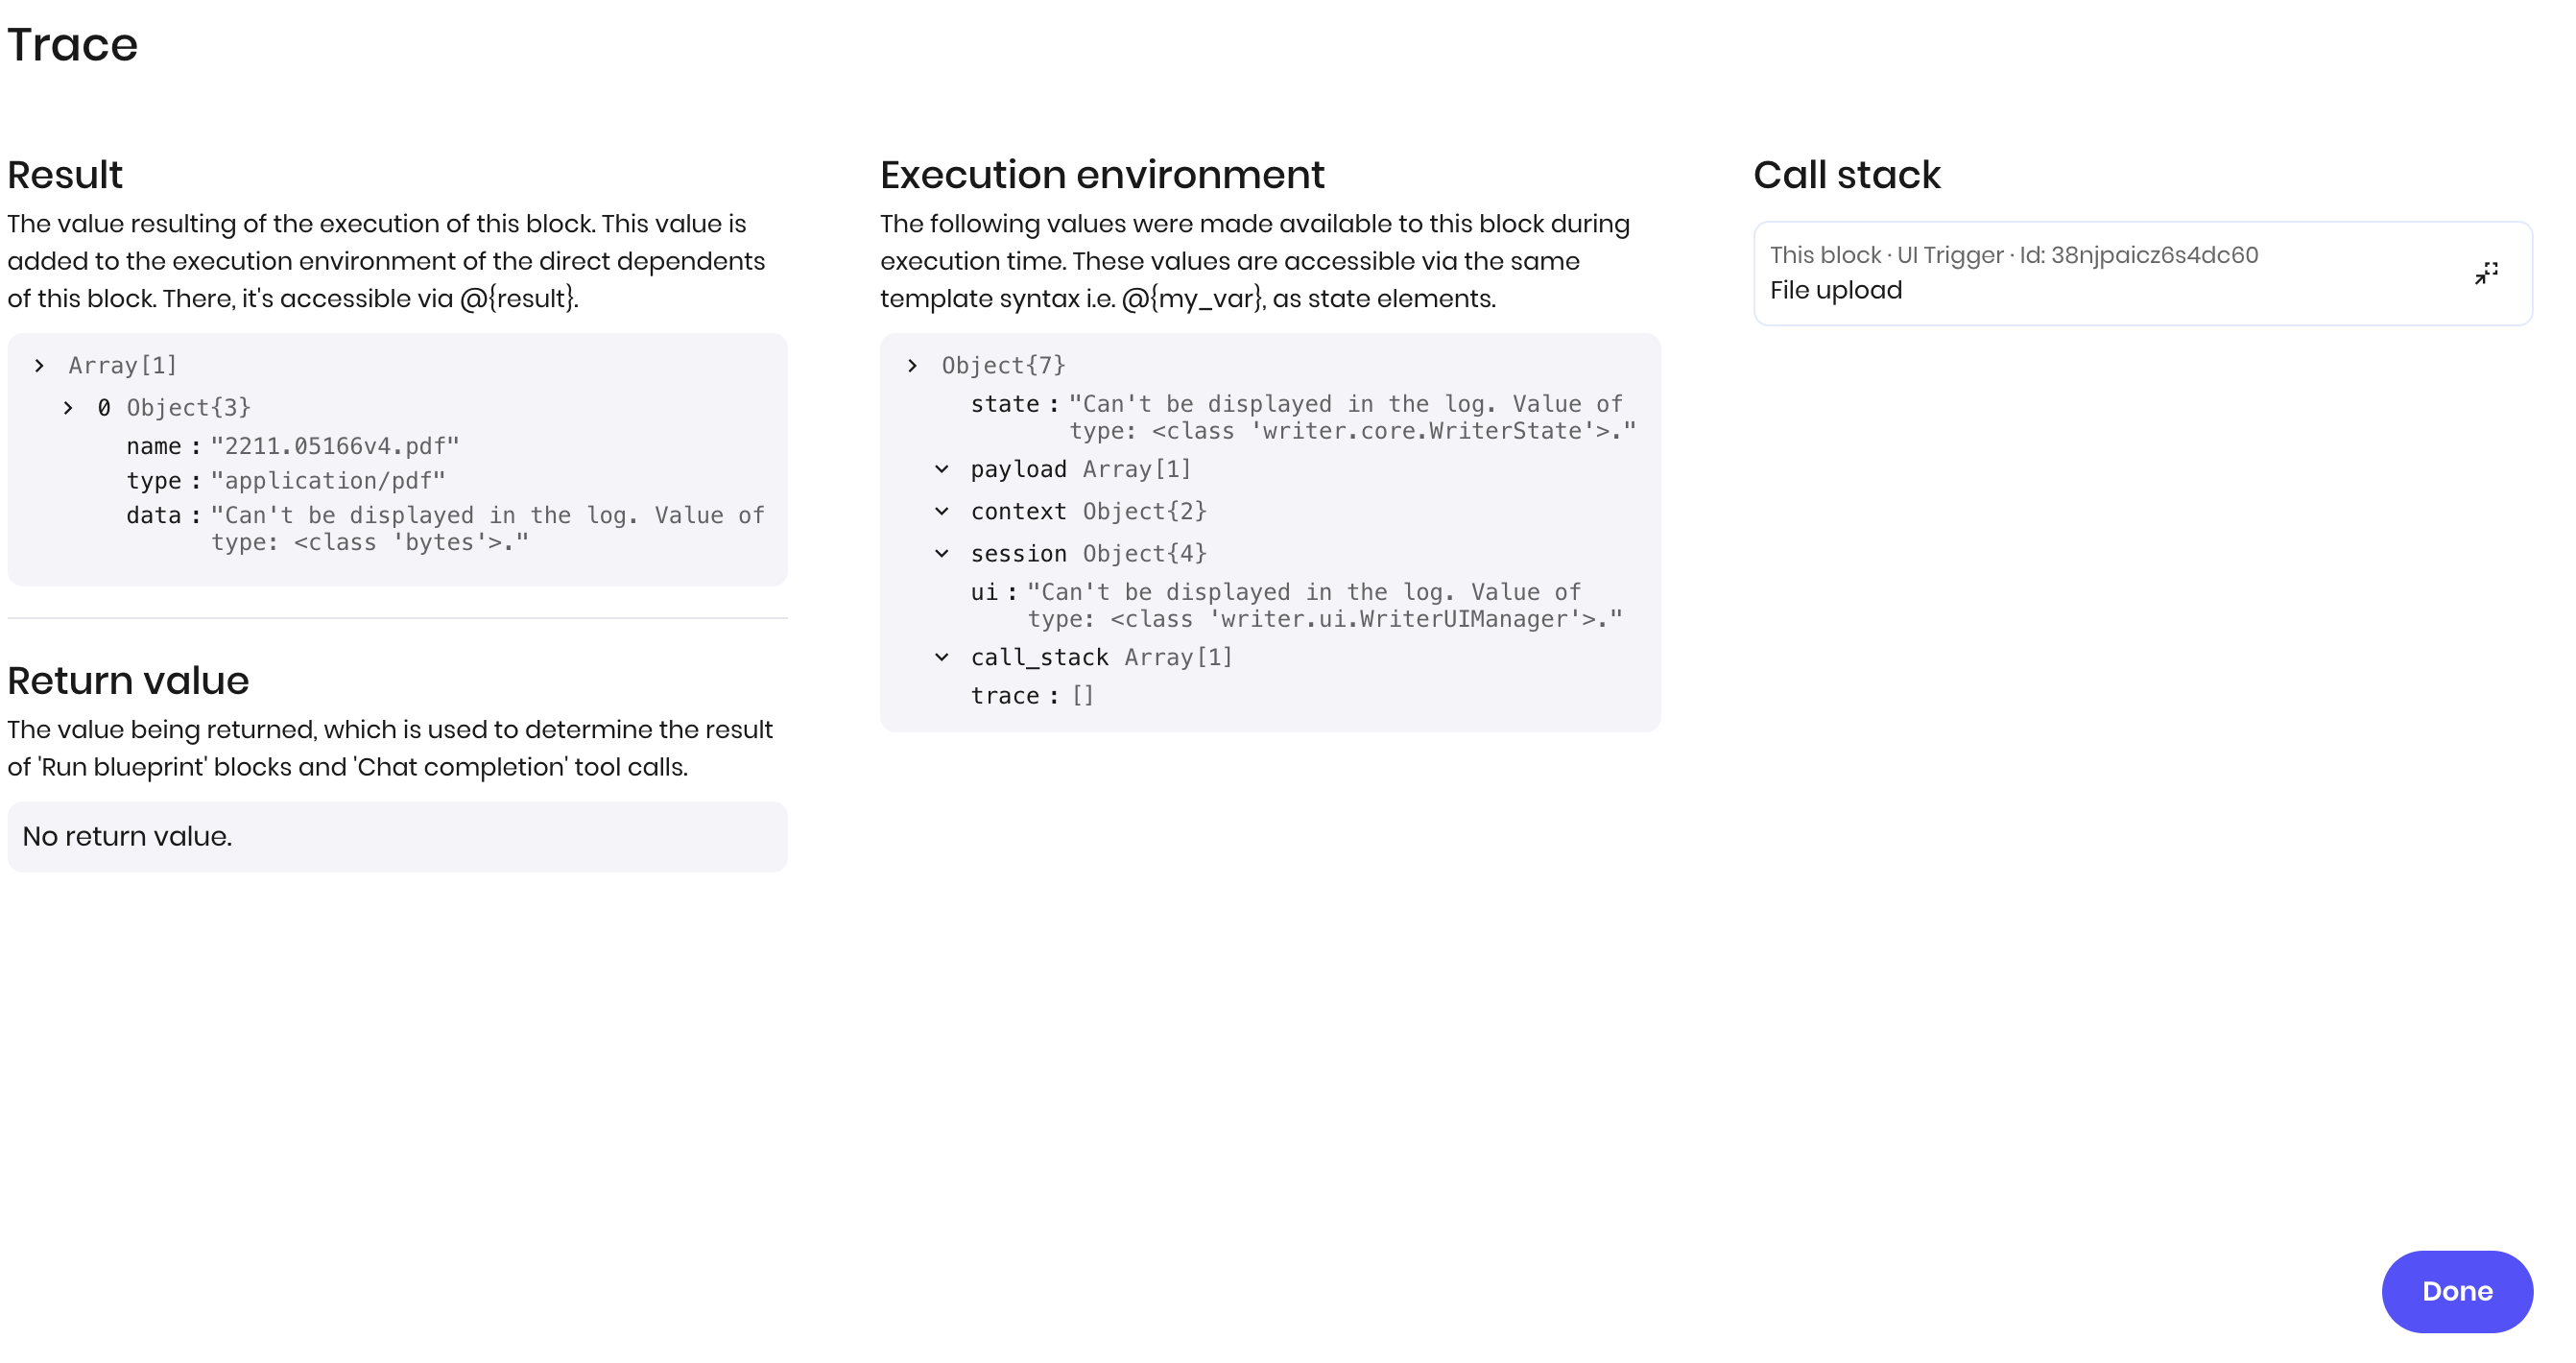
 The trace link opens a new tab with a detailed view of the agent's execution at that point in time. It contains:
* The value resulting from the block's execution, which is then added to the execution environment of the following block
* The return value, if the block has one
* The full execution environment at that point in time
* The call stack
Below is an example of a trace after a **File upload** block has completed.
The trace link opens a new tab with a detailed view of the agent's execution at that point in time. It contains:
* The value resulting from the block's execution, which is then added to the execution environment of the following block
* The return value, if the block has one
* The full execution environment at that point in time
* The call stack
Below is an example of a trace after a **File upload** block has completed.
 ## Inspect agent state
You can use the **State explorer** to view an agent's state variables and their values. This is helpful when you're debugging an agent or need to check the state at a given point in the execution.
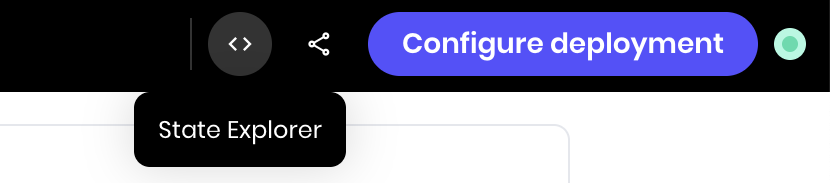
To access the state explorer, click the **State explorer** icon in the top right corner of the page.
## Inspect agent state
You can use the **State explorer** to view an agent's state variables and their values. This is helpful when you're debugging an agent or need to check the state at a given point in the execution.
To access the state explorer, click the **State explorer** icon in the top right corner of the page.
 ## Observe agent usage and performance
You can view usage and performance metrics for your agent in the **Observability** tab. To get to this view, select the agent from the [AI Studio homepage](https://app.writer.com/ai-studio) and navigate to the **Observability** tab.
Here, you can view:
* Performance: Requests, errors, latency, and throughput
* Usage: Total requests, tokens, and cost, along with a geographic breakdown of requests
* Logs: Logs from individual requests
## Observe agent usage and performance
You can view usage and performance metrics for your agent in the **Observability** tab. To get to this view, select the agent from the [AI Studio homepage](https://app.writer.com/ai-studio) and navigate to the **Observability** tab.
Here, you can view:
* Performance: Requests, errors, latency, and throughput
* Usage: Total requests, tokens, and cost, along with a geographic breakdown of requests
* Logs: Logs from individual requests