> ## Documentation Index
> Fetch the complete documentation index at: https://dev.writer.com/llms.txt
> Use this file to discover all available pages before exploring further.
# Build data tables with DataFrames
The [**DataFrame** component](/components/dataframe) lets you display structured data in a table format with built-in features like sorting, searching, and downloading. It's designed to work with [Pandas DataFrames](https://pandas.pydata.org/docs/reference/api/pandas.DataFrame.html) or [PyArrow tables](https://arrow.apache.org/docs/python/generated/pyarrow.Table.html).
## Overview
DataFrames allow you to present data in a grid format. They provide an interface with built-in features like sorting, searching, and downloading. They work well for displaying lists of records, reports, or any tabular data that you've processed with Python.
### When to use DataFrames
DataFrames are useful for:
* **Data analysis results** from pandas operations
* **CSV file uploads** that need to be displayed as tables
* **Database query results** formatted as DataFrames
* **Any data that benefits from sorting and filtering**
* **Reports that users might want to download as CSV**
## Example: Display a sales report
This example creates a sales report from hardcoded data. It processes data with pandas and displays it in a DataFrame.
Open the **Code** tab at the bottom of the agent's interface and navigate to the `main.py` file.
Add the following code to the `main.py` file. It creates a pandas DataFrame with the sales data and sets it in the state as `sales_report`.
```python theme={null}
import pandas as pd
import writer as wf
# Sample sales data
sales_data = [
{"rep_name": "Sarah Chen", "region": "West", "product": "Software License", "amount": 15000, "quarter": "Q3 2024"},
{"rep_name": "Mike Rodriguez", "region": "East", "product": "Consulting", "amount": 8500, "quarter": "Q3 2024"},
{"rep_name": "Alex Johnson", "region": "Central", "product": "Software License", "amount": 22000, "quarter": "Q3 2024"},
{"rep_name": "Sarah Chen", "region": "West", "product": "Support Package", "amount": 5000, "quarter": "Q3 2024"},
{"rep_name": "Lisa Park", "region": "East", "product": "Software License", "amount": 18000, "quarter": "Q3 2024"},
{"rep_name": "Mike Rodriguez", "region": "East", "product": "Consulting", "amount": 12000, "quarter": "Q3 2024"}
]
# Create pandas DataFrame
df = pd.DataFrame(sales_data)
# Set the DataFrame in state
initial_state = wf.init_state({
"sales_report": df
})
```
Navigate to the **Interface** tab to build the agent's interface.
Add a **DataFrame** component to your page. Update the following settings:
* **Data**: `@{sales_report}`. This is the state variable that contains the sales report data.
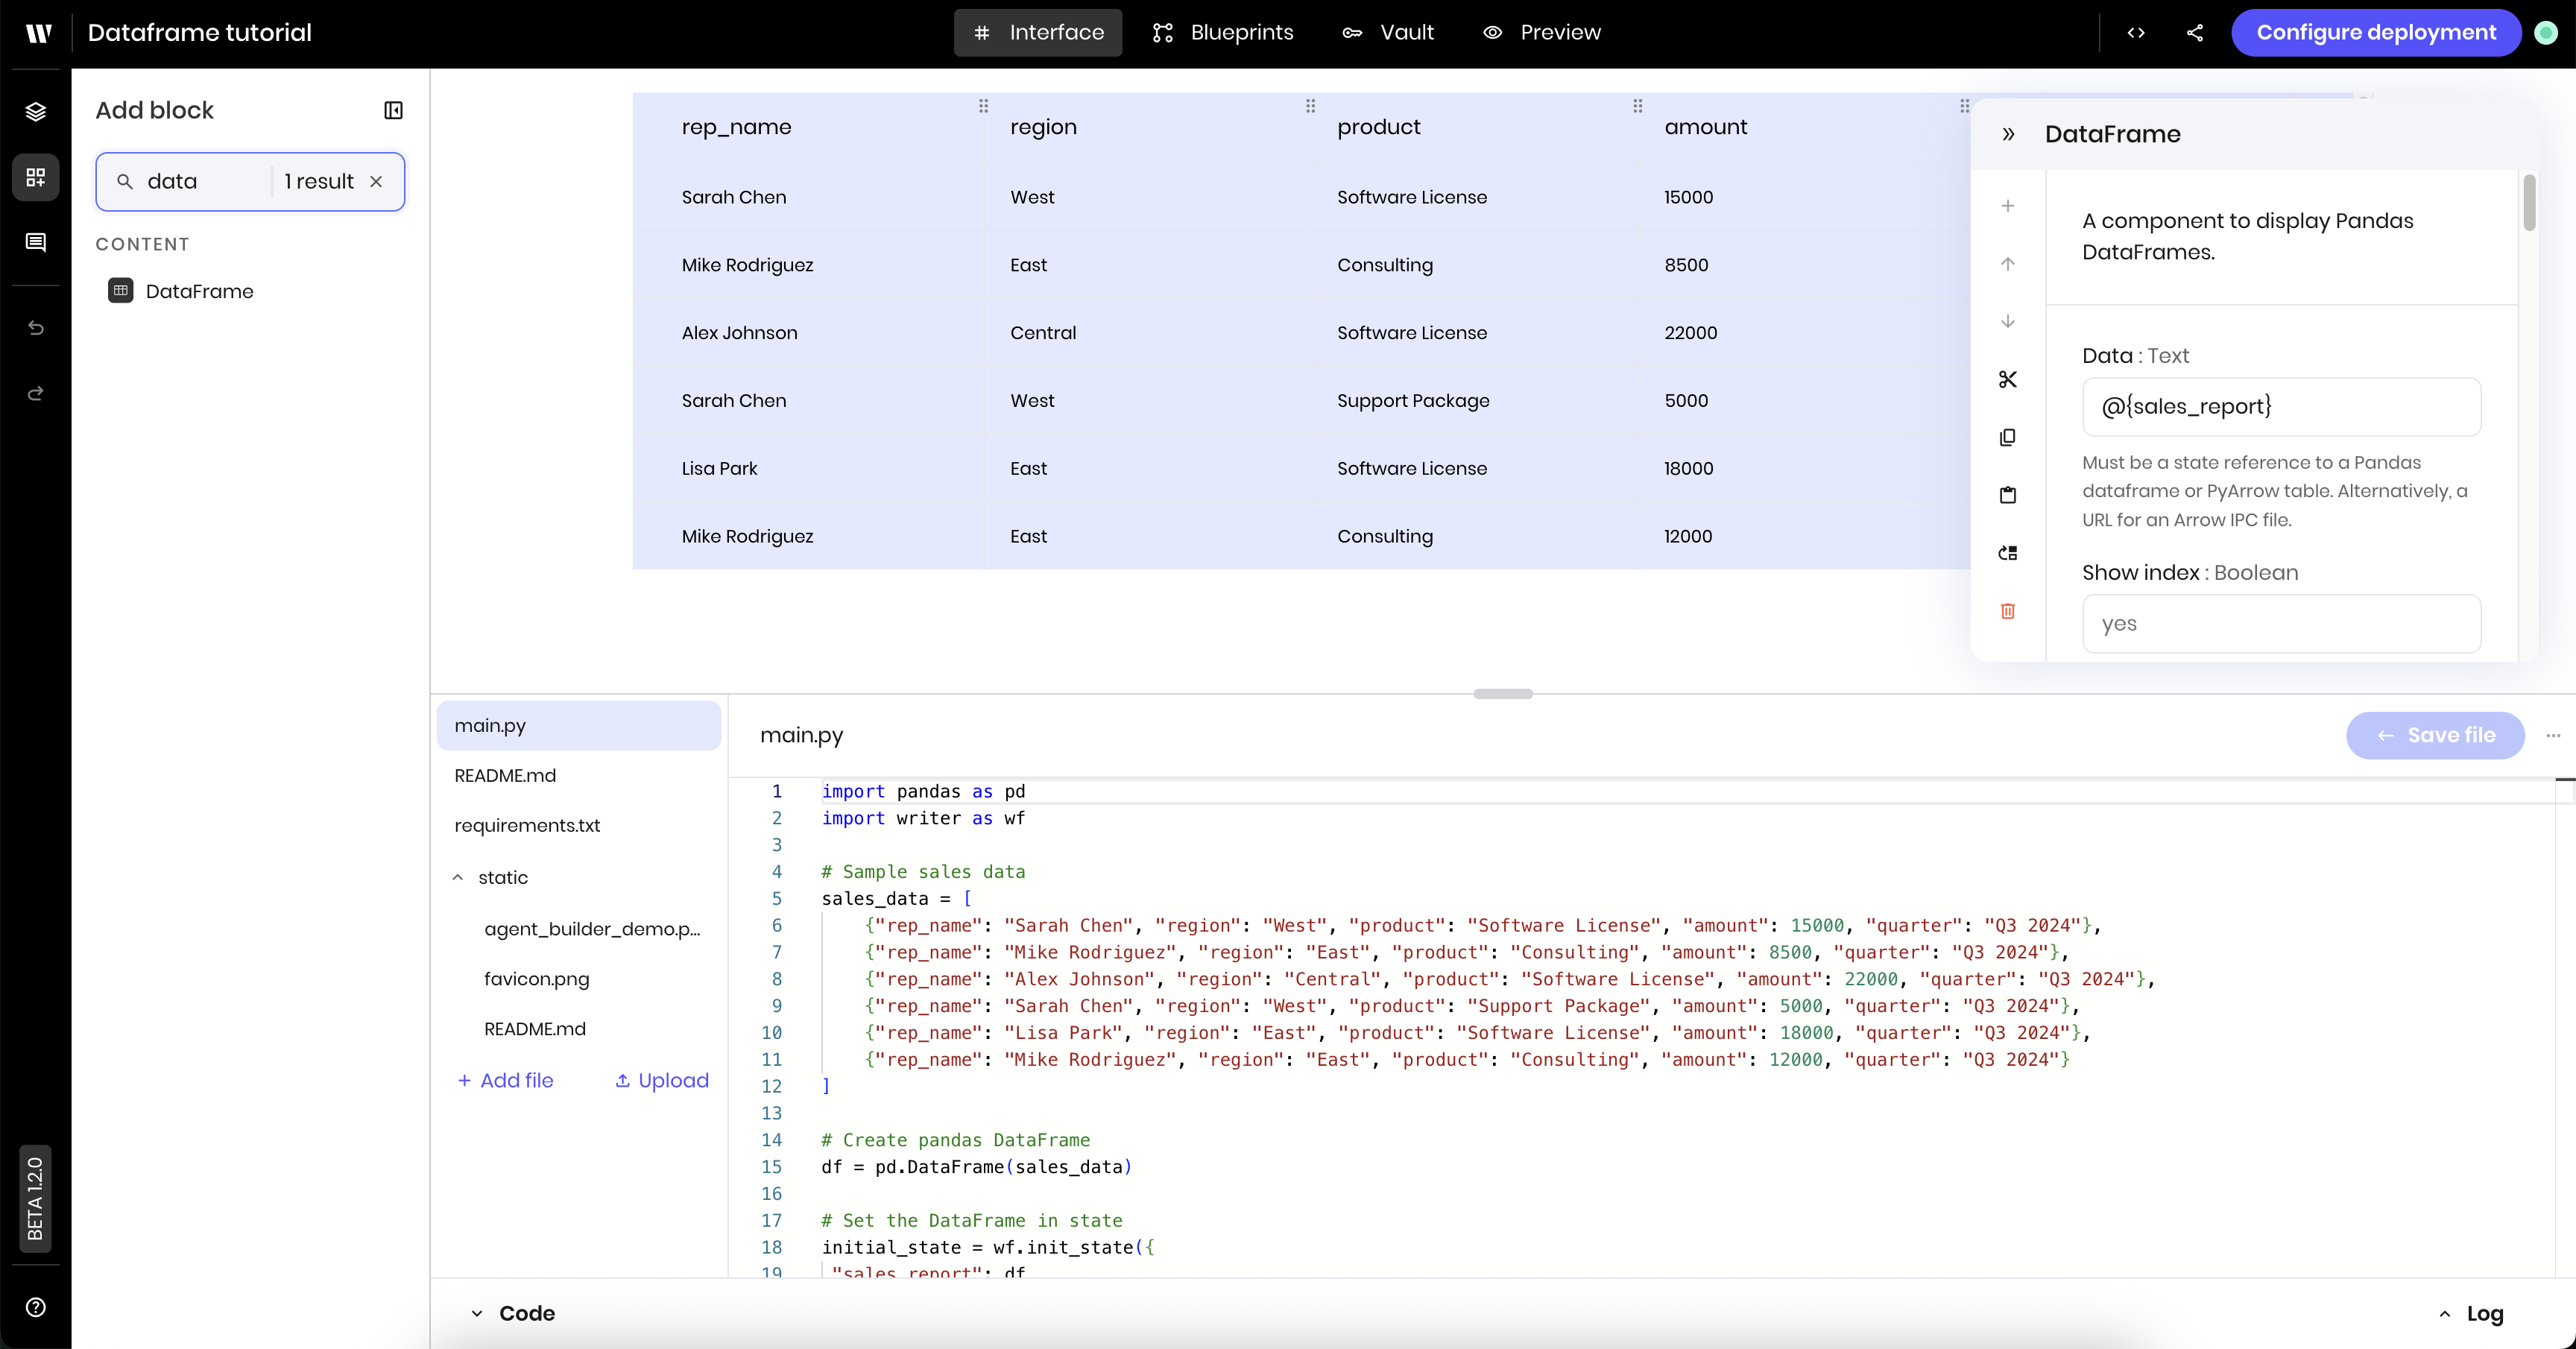 ### Preview the DataFrame
Navigate to the **Preview** tab to see the DataFrame in action.
You should see a table with columns for sales rep, region, product, amount, and quarter.
Try clicking column headers to sort by amount or region.
### Enable advanced features
Navigate back to the **Interface** tab to click on the DataFrame component. There, you can enable more features, like search, download, and editing or adding records.
1. **Enable Search**: In the DataFrame component settings, set **Enable search** to `yes`
2. **Enable Download**: Set **Enable download** to `yes`
3. **Optionally enable editing**: Set **Enable adding a record** and **Enable updating a record** to `yes` if you want users to modify data
4. **Test the enhanced features**:
* Search for specific sales reps or regions
* Sort by amount to see top performers
* Download the data as CSV for further analysis
## Example: CSV file upload and processing
This example shows how to upload a CSV file and process the data with pandas to then display it in a DataFrame.
The example assumes you have a CSV file with the following columns:
* `product_category`
* `product_name`
* `quantity`
* `unit_price`
* `sales_rep`
* `date`
* `region`
It processes the data to calculate the total revenue for each product category and displays the data in a DataFrame.
Below is an example of the CSV file that you can use to test the agent:
```csv theme={null}
product_category,product_name,quantity,unit_price,sales_rep,date,region
Software,CRM Pro,2,5000,Sarah Chen,2024-07-15,West
Hardware,Server Rack,1,8000,Mike Rodriguez,2024-07-18,East
Software,Analytics Suite,3,3000,Alex Johnson,2024-07-22,Central
Consulting,Implementation Service,5,1200,Sarah Chen,2024-07-25,West
Hardware,Network Switch,4,2500,Lisa Park,2024-08-02,East
Software,CRM Pro,1,5000,Mike Rodriguez,2024-08-05,East
Consulting,Training Package,8,800,Alex Johnson,2024-08-10,Central
Software,Analytics Suite,2,3000,Sarah Chen,2024-08-12,West
Hardware,Server Rack,2,8000,Lisa Park,2024-08-15,East
Consulting,Implementation Service,3,1200,Mike Rodriguez,2024-08-20,East
Software,CRM Pro,4,5000,Alex Johnson,2024-08-22,Central
Hardware,Network Switch,2,2500,Sarah Chen,2024-08-25,West
```
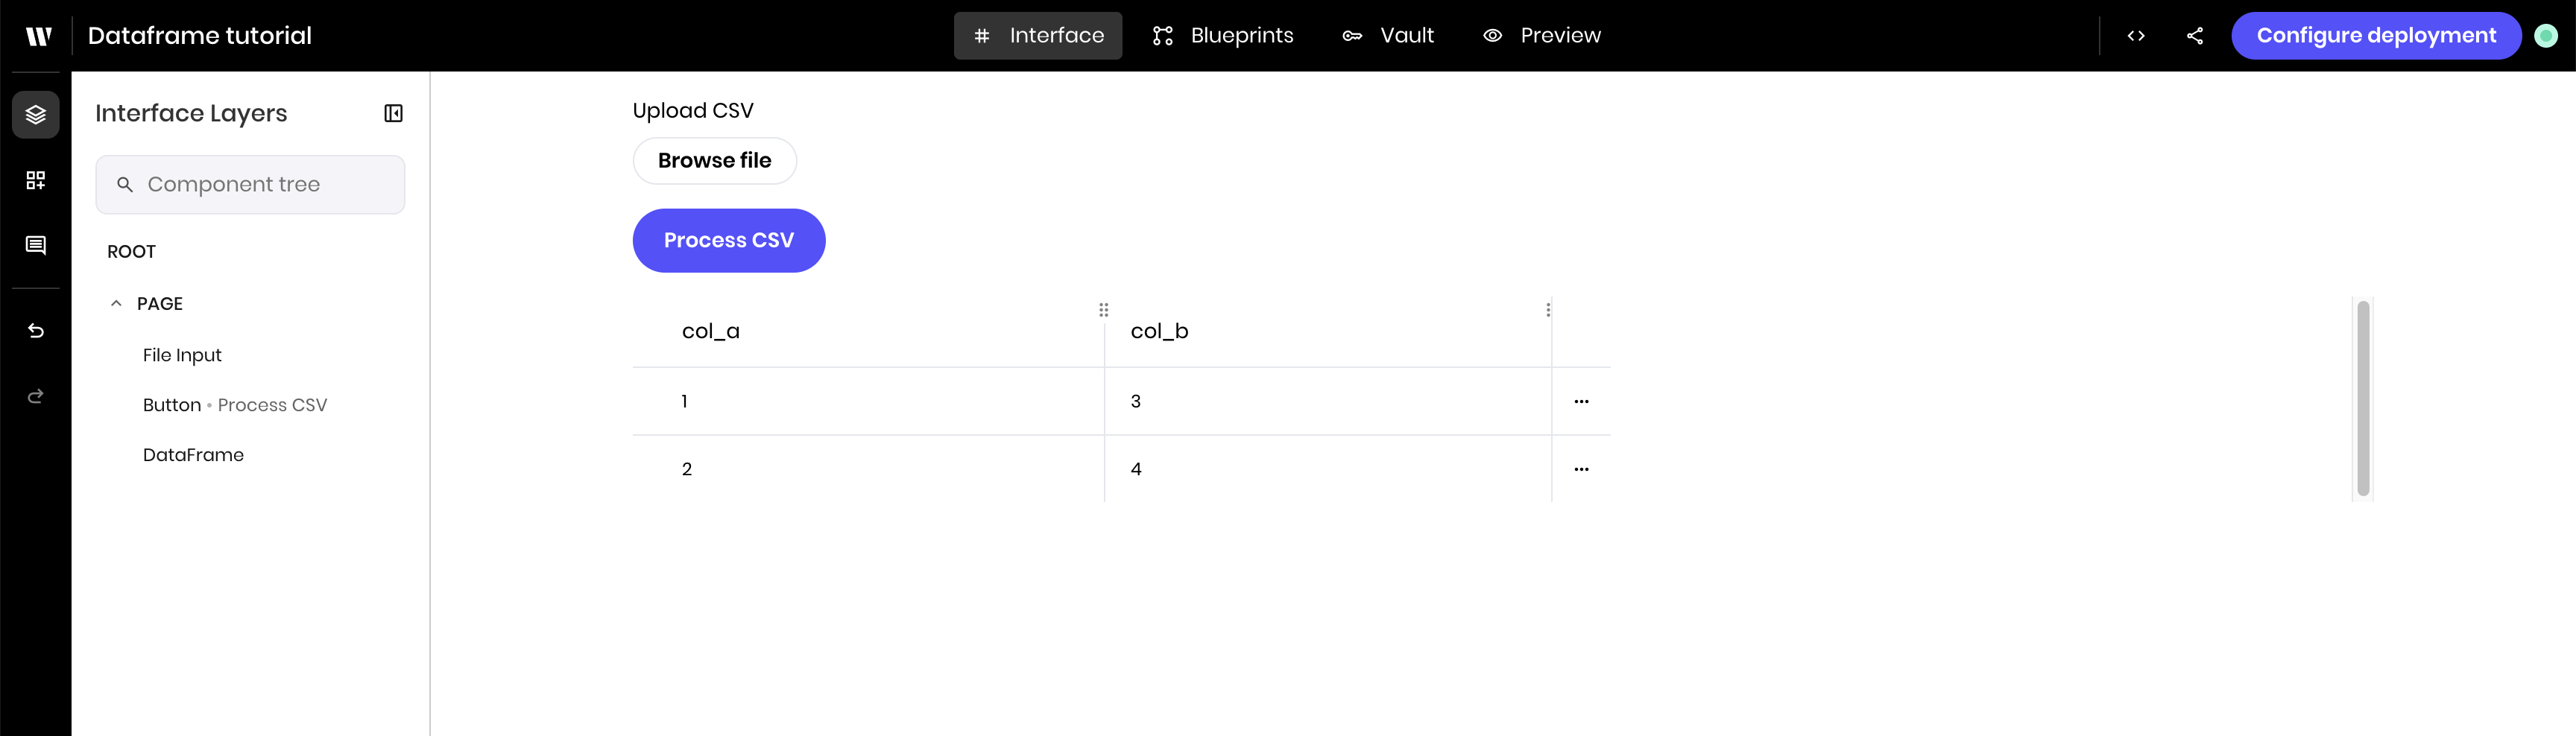
### Build the interface
Navigate to the **Interface** tab to build the agent's interface.
Add a **File input** component to your page. Update the following settings:
* **Label**: `Upload CSV`
* **Allowed file types**: `.csv`
* **Link variable** under **Binding**: `input_file`
Add a **Button** component to your page. Update the following settings:
* **Label**: `Process CSV`
Add a **DataFrame** component to your page. Update the following settings:
* **Data**: `@{processed_data}`. This is the state variable that will contain the processed data after you build the blueprint.
The interface should look like this:
### Preview the DataFrame
Navigate to the **Preview** tab to see the DataFrame in action.
You should see a table with columns for sales rep, region, product, amount, and quarter.
Try clicking column headers to sort by amount or region.
### Enable advanced features
Navigate back to the **Interface** tab to click on the DataFrame component. There, you can enable more features, like search, download, and editing or adding records.
1. **Enable Search**: In the DataFrame component settings, set **Enable search** to `yes`
2. **Enable Download**: Set **Enable download** to `yes`
3. **Optionally enable editing**: Set **Enable adding a record** and **Enable updating a record** to `yes` if you want users to modify data
4. **Test the enhanced features**:
* Search for specific sales reps or regions
* Sort by amount to see top performers
* Download the data as CSV for further analysis
## Example: CSV file upload and processing
This example shows how to upload a CSV file and process the data with pandas to then display it in a DataFrame.
The example assumes you have a CSV file with the following columns:
* `product_category`
* `product_name`
* `quantity`
* `unit_price`
* `sales_rep`
* `date`
* `region`
It processes the data to calculate the total revenue for each product category and displays the data in a DataFrame.
Below is an example of the CSV file that you can use to test the agent:
```csv theme={null}
product_category,product_name,quantity,unit_price,sales_rep,date,region
Software,CRM Pro,2,5000,Sarah Chen,2024-07-15,West
Hardware,Server Rack,1,8000,Mike Rodriguez,2024-07-18,East
Software,Analytics Suite,3,3000,Alex Johnson,2024-07-22,Central
Consulting,Implementation Service,5,1200,Sarah Chen,2024-07-25,West
Hardware,Network Switch,4,2500,Lisa Park,2024-08-02,East
Software,CRM Pro,1,5000,Mike Rodriguez,2024-08-05,East
Consulting,Training Package,8,800,Alex Johnson,2024-08-10,Central
Software,Analytics Suite,2,3000,Sarah Chen,2024-08-12,West
Hardware,Server Rack,2,8000,Lisa Park,2024-08-15,East
Consulting,Implementation Service,3,1200,Mike Rodriguez,2024-08-20,East
Software,CRM Pro,4,5000,Alex Johnson,2024-08-22,Central
Hardware,Network Switch,2,2500,Sarah Chen,2024-08-25,West
```
### Build the interface
Navigate to the **Interface** tab to build the agent's interface.
Add a **File input** component to your page. Update the following settings:
* **Label**: `Upload CSV`
* **Allowed file types**: `.csv`
* **Link variable** under **Binding**: `input_file`
Add a **Button** component to your page. Update the following settings:
* **Label**: `Process CSV`
Add a **DataFrame** component to your page. Update the following settings:
* **Data**: `@{processed_data}`. This is the state variable that will contain the processed data after you build the blueprint.
The interface should look like this:
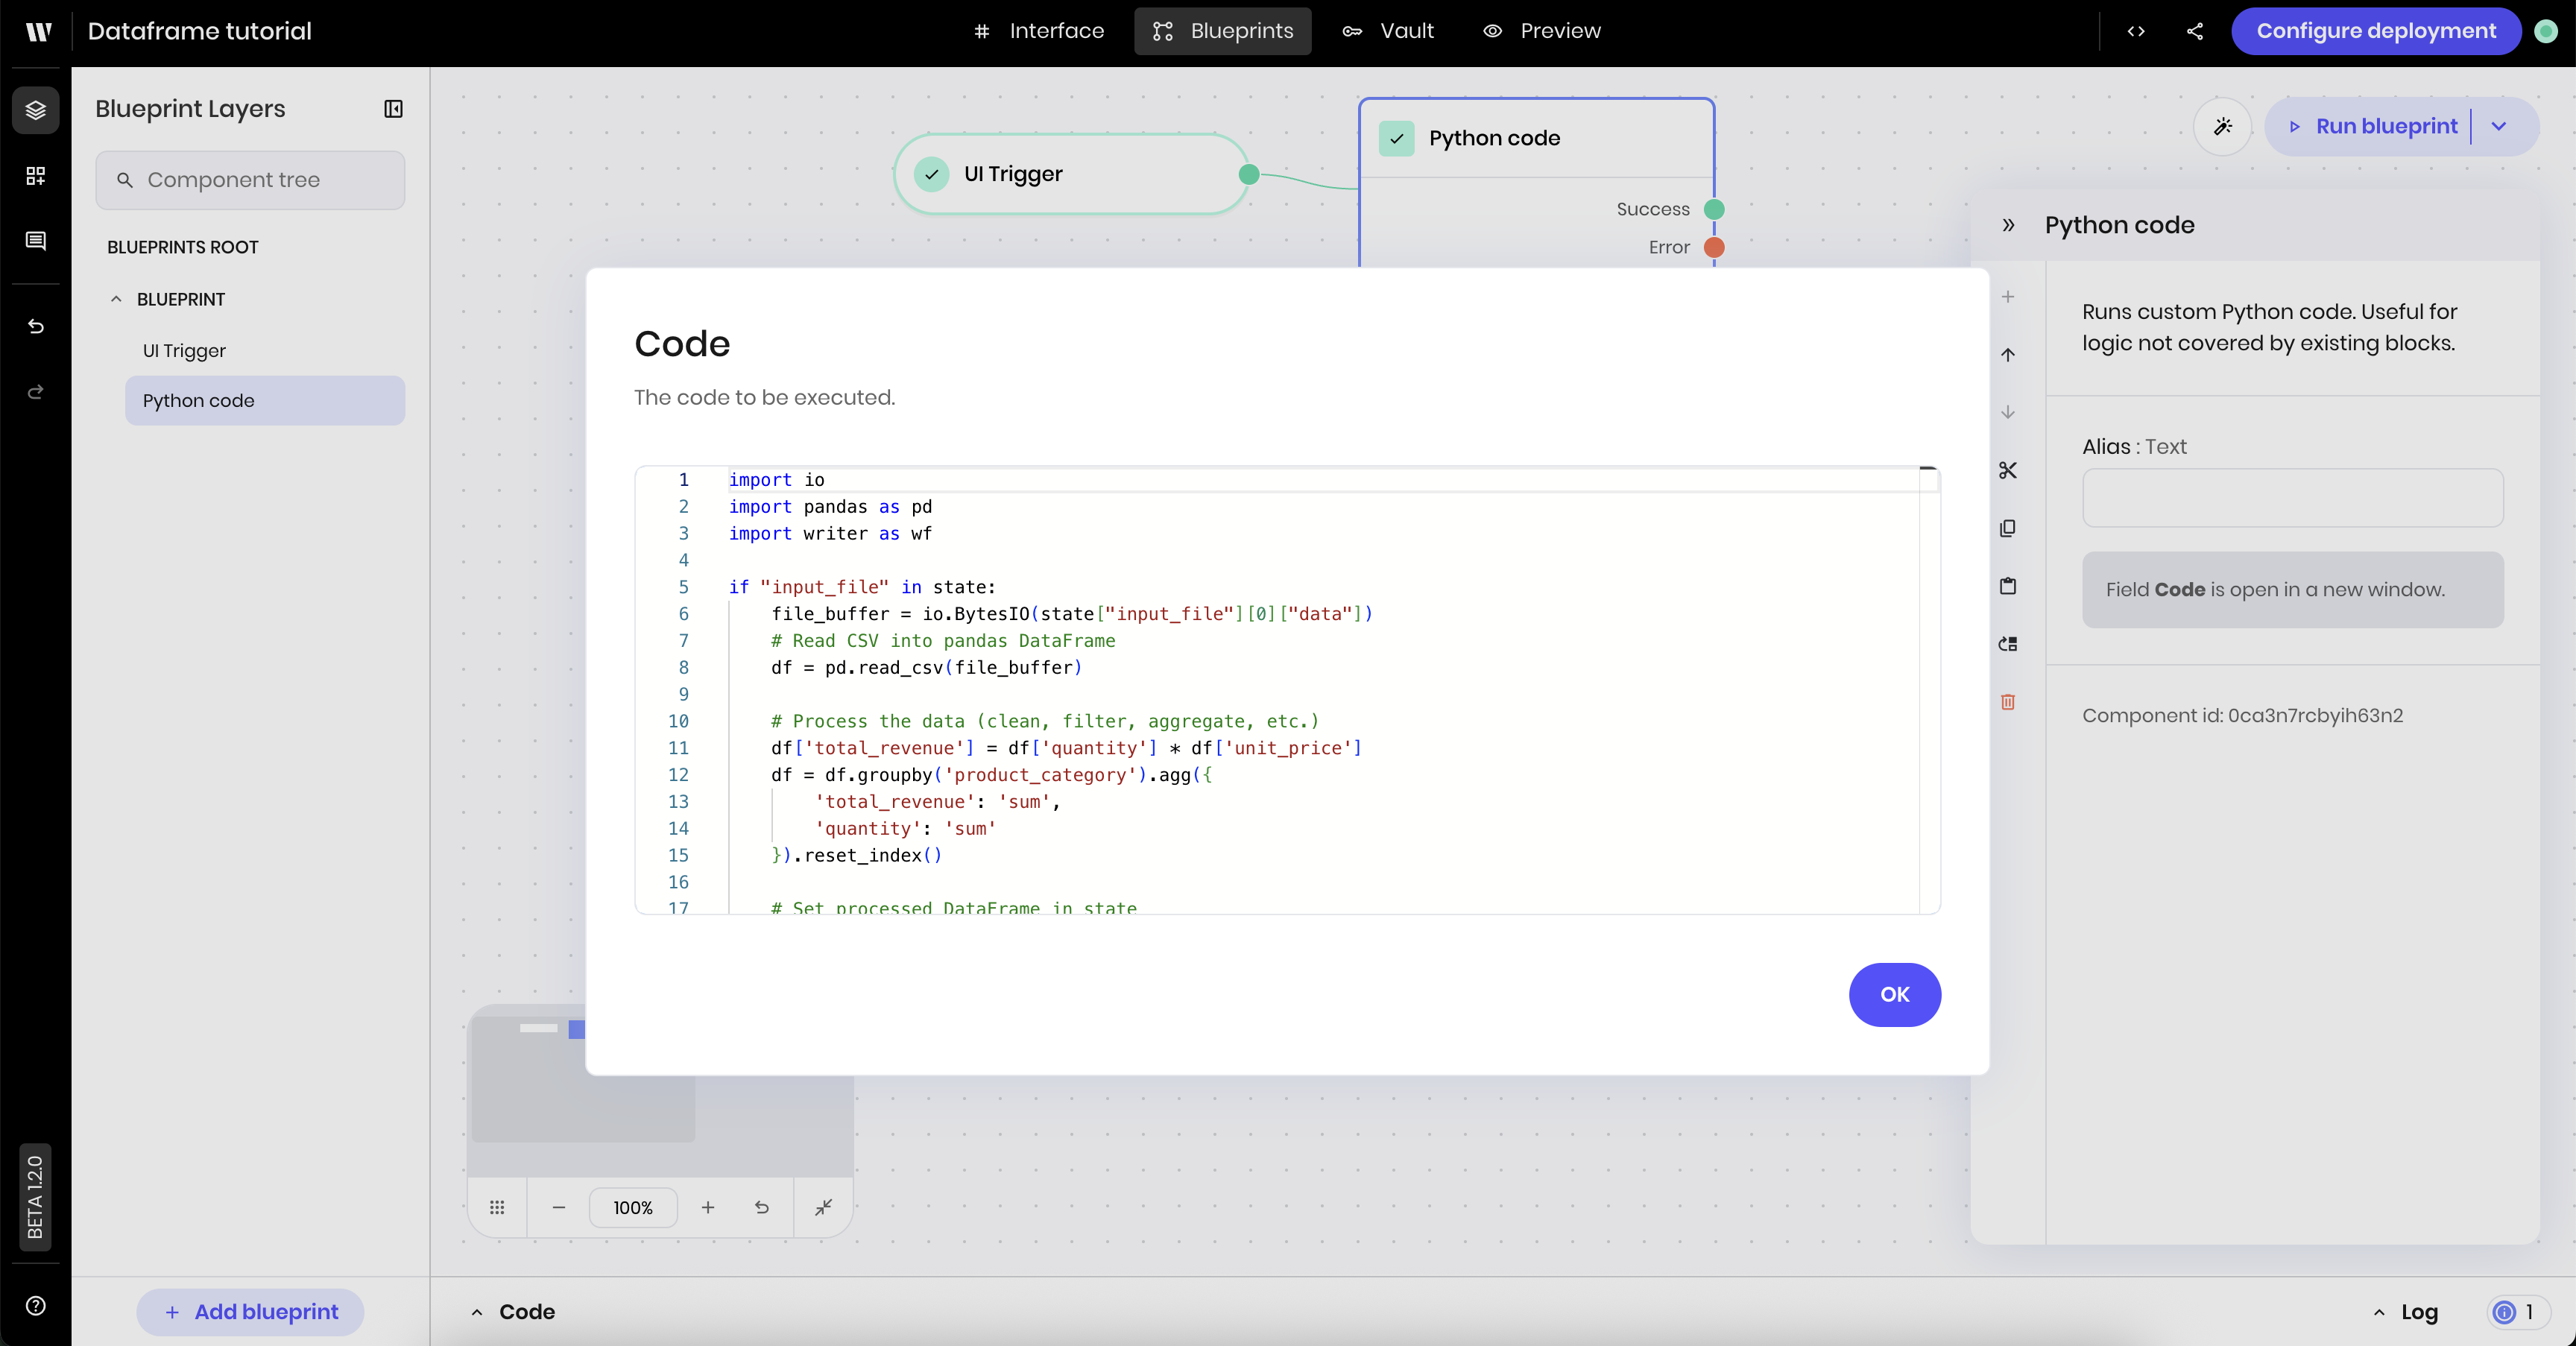
 ### Build the blueprint
Open the **Blueprint** tab to build the agent's blueprint. The blueprint contains:
* A **UI Trigger** that triggers blueprint execution when the user clicks the **Upload CSV** button.
* A **Python** block that processes the uploaded file and stores the data in a state variable.
Add a **UI Trigger** to the blueprint. Update the following settings:
* **Component Id**: Select the **Process CSV** button you added to the interface.
* **Event type**: `wf-click`
Add a **Python code** block to the blueprint. Then paste the following code into the block. The code reads the uploaded file, processes the data, and stores the processed data in a state variable.
```python theme={null}
import io
import pandas as pd
import writer as wf
if "input_file" in state:
# Read the uploaded file into a buffer
file_buffer = io.BytesIO(state["input_file"][0]["data"])
# Read buffer into pandas DataFrame
df = pd.read_csv(file_buffer)
# Process the data to calculate the total revenue for each product category
df['total_revenue'] = df['quantity'] * df['unit_price']
df = df.groupby('product_category').agg({
'total_revenue': 'sum',
'quantity': 'sum'
}).reset_index()
# Set processed DataFrame in state
state["processed_data"] = df
```
The blueprint should look like this, with the Python block containing the code to process the uploaded file and store the processed data in a state variable.
### Build the blueprint
Open the **Blueprint** tab to build the agent's blueprint. The blueprint contains:
* A **UI Trigger** that triggers blueprint execution when the user clicks the **Upload CSV** button.
* A **Python** block that processes the uploaded file and stores the data in a state variable.
Add a **UI Trigger** to the blueprint. Update the following settings:
* **Component Id**: Select the **Process CSV** button you added to the interface.
* **Event type**: `wf-click`
Add a **Python code** block to the blueprint. Then paste the following code into the block. The code reads the uploaded file, processes the data, and stores the processed data in a state variable.
```python theme={null}
import io
import pandas as pd
import writer as wf
if "input_file" in state:
# Read the uploaded file into a buffer
file_buffer = io.BytesIO(state["input_file"][0]["data"])
# Read buffer into pandas DataFrame
df = pd.read_csv(file_buffer)
# Process the data to calculate the total revenue for each product category
df['total_revenue'] = df['quantity'] * df['unit_price']
df = df.groupby('product_category').agg({
'total_revenue': 'sum',
'quantity': 'sum'
}).reset_index()
# Set processed DataFrame in state
state["processed_data"] = df
```
The blueprint should look like this, with the Python block containing the code to process the uploaded file and store the processed data in a state variable.
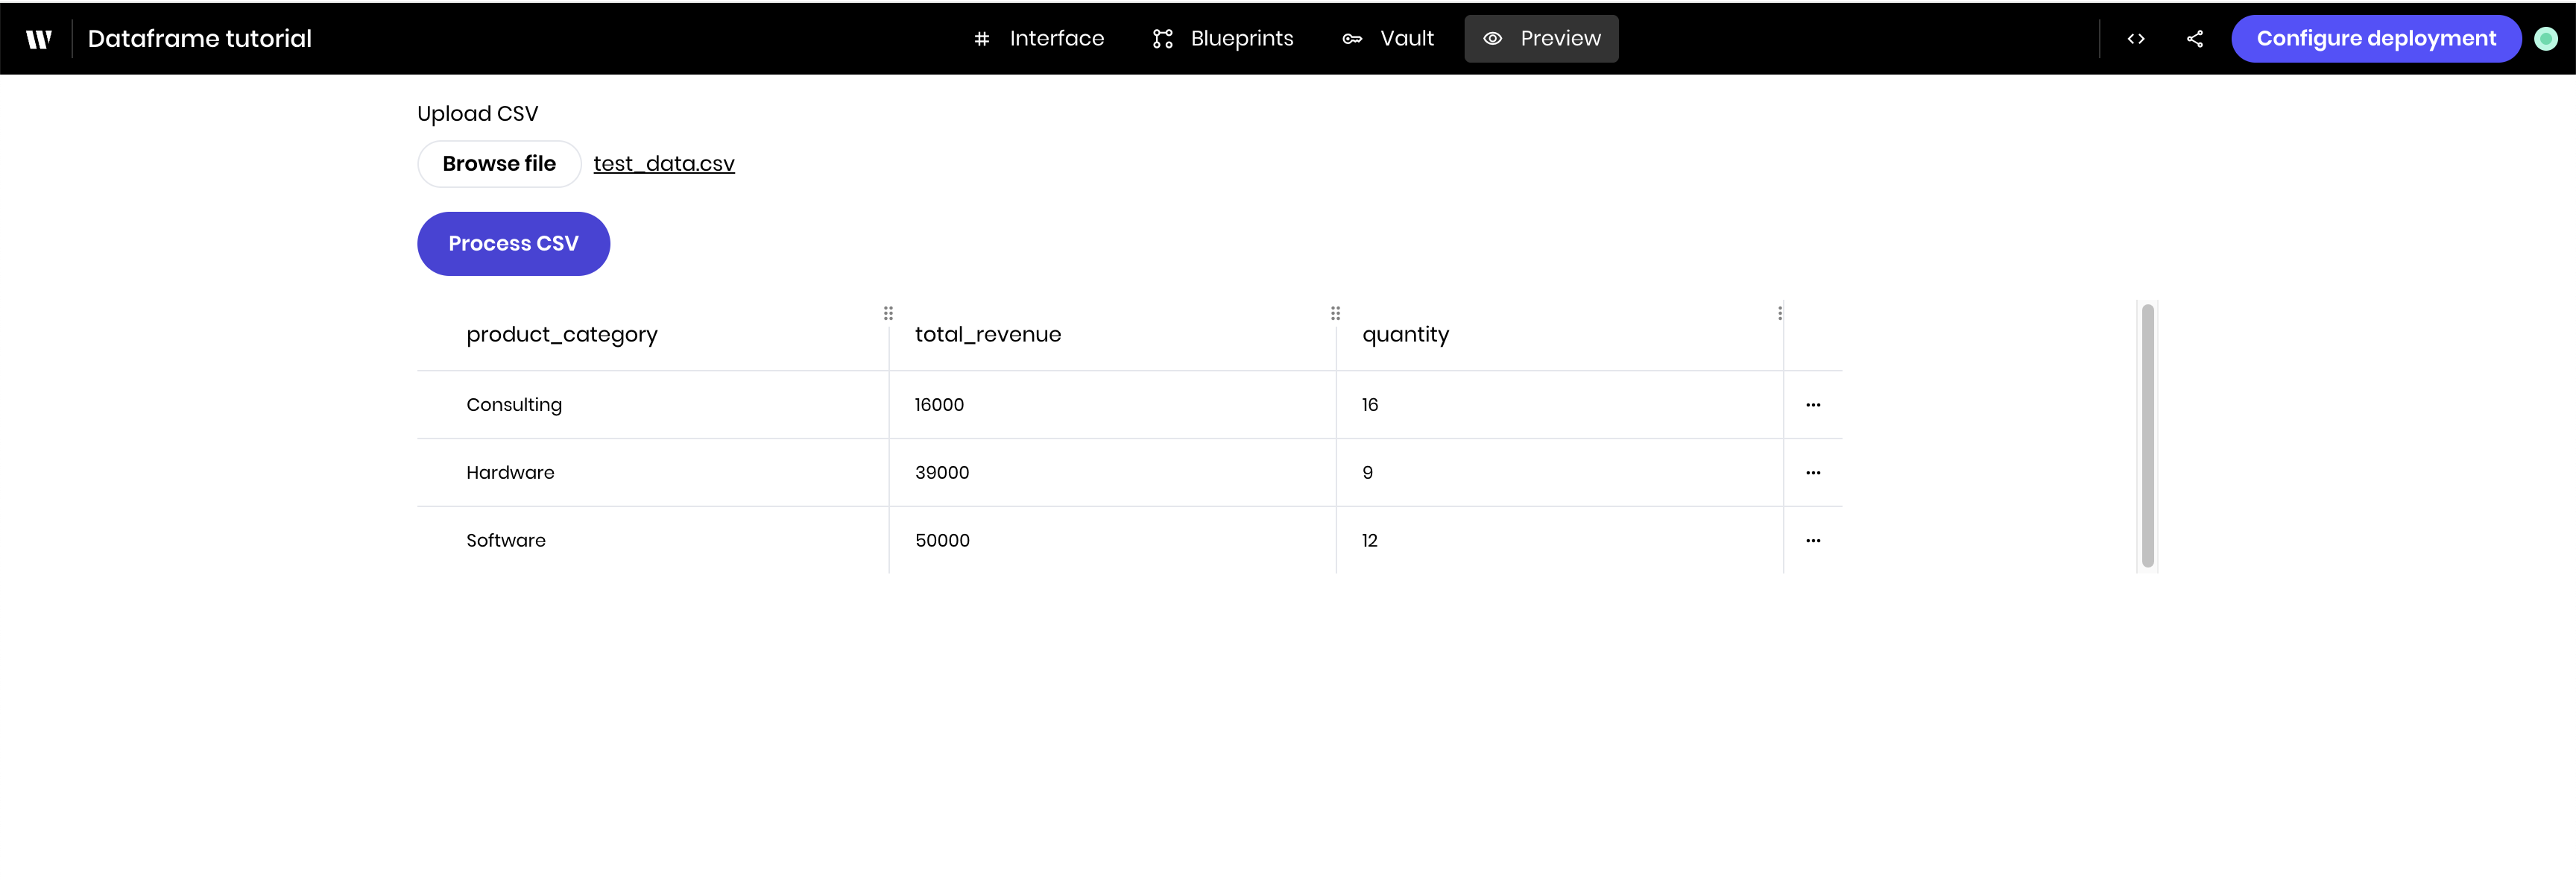
 ### Preview the agent
Navigate to the **Preview** tab to see the agent in action. You should see a button to upload a CSV file and a table to display the processed data.
Upload a CSV file; see the [beginning of this example](#example%3A-csv-file-upload-and-processing) for a sample CSV file.
Once you click the **Process CSV** button, the agent processes the data and displays it in the DataFrame component.
### Preview the agent
Navigate to the **Preview** tab to see the agent in action. You should see a button to upload a CSV file and a table to display the processed data.
Upload a CSV file; see the [beginning of this example](#example%3A-csv-file-upload-and-processing) for a sample CSV file.
Once you click the **Process CSV** button, the agent processes the data and displays it in the DataFrame component.
 ## Best practices
1. **Use pandas for data processing**: Clean, aggregate, and transform data before display
2. **Keep DataFrames reasonably sized**: Use "Display row count" to control how many rows show simultaneously
3. **Enable appropriate features**: Only enable editing if users should modify data
4. **Consider text wrapping**: Toggle "Wrap text" based on your data content
5. **Use meaningful column names**: Pandas column names become the table headers
## Next steps
Try extending this example by:
* Adding more sophisticated pandas operations such as `groupby` and `pivot_tables`
* Connecting to real databases or APIs
* Creating calculated columns based on business rules
* Styling the component with custom CSS classes
## Best practices
1. **Use pandas for data processing**: Clean, aggregate, and transform data before display
2. **Keep DataFrames reasonably sized**: Use "Display row count" to control how many rows show simultaneously
3. **Enable appropriate features**: Only enable editing if users should modify data
4. **Consider text wrapping**: Toggle "Wrap text" based on your data content
5. **Use meaningful column names**: Pandas column names become the table headers
## Next steps
Try extending this example by:
* Adding more sophisticated pandas operations such as `groupby` and `pivot_tables`
* Connecting to real databases or APIs
* Creating calculated columns based on business rules
* Styling the component with custom CSS classes